. 2021 Jun 15;50(15):8400–8413. doi: 10.1039/d0cs00558d

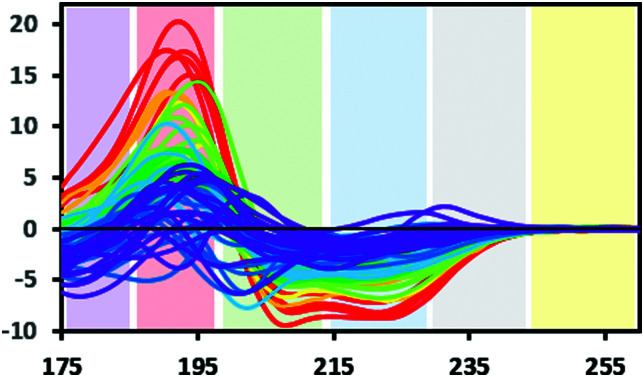
Fig. 3. Bands defining the approximate wavelength range for electronic transitions responsible for the CD signals: Yellow: Signals due to aromatic residues (if present) may be detected in 100× pathlength cells; grey: occasionally a signal may be detected here due to the presence of stacked aromatic amino acids,1 blue: n → π* transition. Green and red: π → π* transition, this transition can give rise to two peaks due to exciton splitting, purple: charge transfer transition (generally only detectable when using synchrotron radiation source) (SRCD spectra). The depicted spectra are from the SP175 dataset21 and are available in the PCDDB35 with codes CD0000010000 to CD0000710000. They are shaded according to percentage of helix in the crystal structure of the protein as follows: red: 70% +, orange: 60–70%, yellow: 50–60%, light green: 40–50%, dark green: 30–40%, light blue: 20–30%, dark blue: 10–20%, purple: 0–10%.

Fig. 3