. 2021 Jun 15;50(15):8400–8413. doi: 10.1039/d0cs00558d

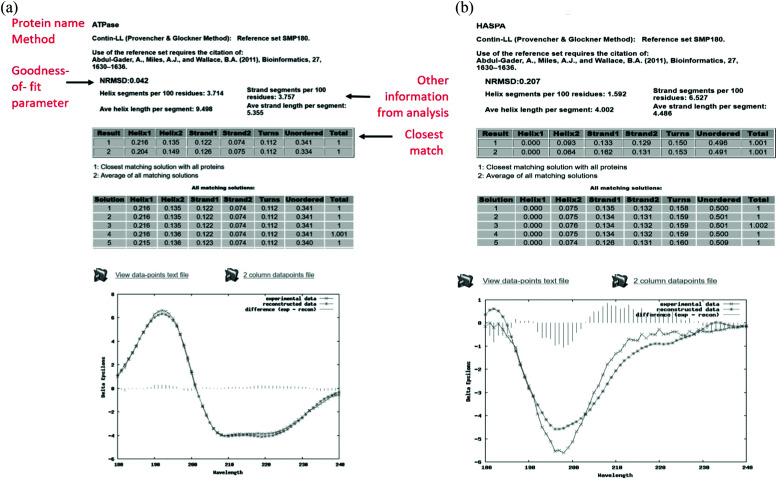
Fig. 5. (a) Example results page obtained using the DichroWeb16 server for a “good quality analysis”. (top) The protein name (ATPase, PCDDB35 code (CD0004003000)) is displayed and the analysis method used [ContinLL15] is listed on the next line. Below this is the NRMSD24 “goodness-of-fit parameter”, which should optimally be <0.1 (as it is in this example), indicating a close correspondence between the back-calculated and measured spectra. If it is not, then another method, reference data set and/or scale factor should be used. (middle) Tables [shaded areas] of calculated secondary structure results obtained using the CONTINLL17 method and the appropriate (SMP180,22 membrane protein) reference data set. The arrow at the right of the top row indicates what is usually the closest/most suitable solution. The lower shaded box indicates other possible solutions obtained using other types of calculations. (bottom) Plot showing a comparison of the experimental spectrum (crosses), the back-calculated closest match spectrum (stars), and the difference spectrum (vertical bars) between the experimental and back-calculated spectra (vertical lines). The low NRMSD24 is consistent with the close match of the calculated and experimental spectra. These, plus the small magnitude difference spectrum indicate this is a “good quality” analysis. (b) Example results page obtained using the DichroWeb17 server for a “poor” quality analysis. This was obtained for an intrinsically disordered protein, HASPA (PCDDB code: CD0005282000). As in Fig. 5a, except in this case neither the (high) NRMSD27 value (>0.1) nor the correspondence between the calculated and experimental spectra, suggest that the best solution is an accurate reflection of the secondary structure. This is because this is an intrinsically disordered protein and is comprised of mostly unordered or disordered (not helical, sheet nor turn) secondary structures. As such it does not have well-defined phi, psi angles, and as the reference dataset does not contain many spectra of proteins with significant amounts of disorder (largely because this type of protein does not tend to crystallise), the NRMSD27 value is high. There is also a greater difference between the experimental and back-calculated spectra for this protein as compared to that for the well-ordered protein depicted in the Fig. 5a.

Fig. 5