. 2021 Jun 15;50(15):8400–8413. doi: 10.1039/d0cs00558d

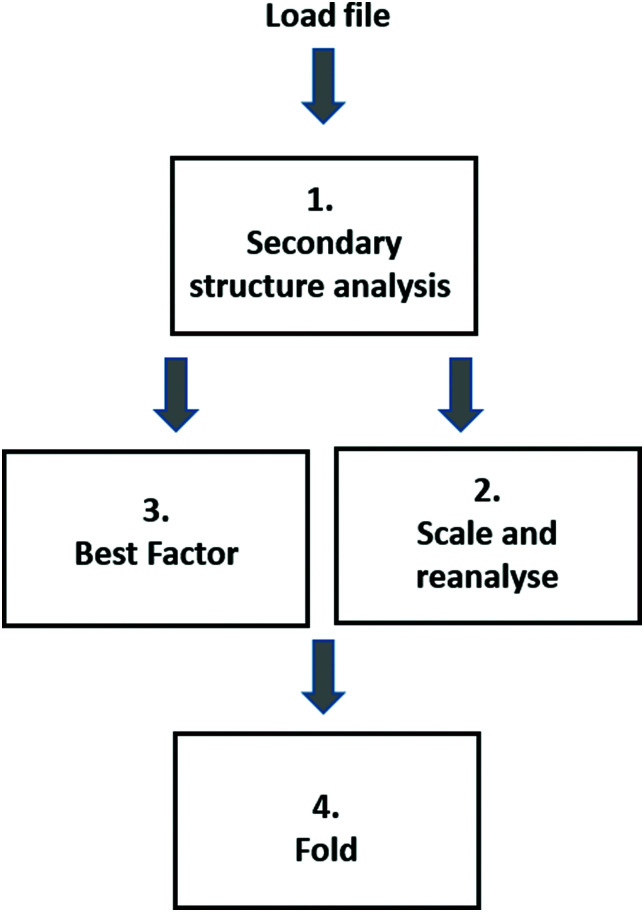
Fig. 6. Workflow for analyses using the BeStSel server.29 (1) The initial secondary structure analysis displays the input spectrum and back-calculated spectrum, along with the predicted secondary structure fractions (displayed both as a table and a pie chart). (2) The experimental spectrum is rescaled by a user-defined factor and reanalysed, or (3) the spectrum is automatically scaled using the “best factor” function. The results of the latter provide a graph of the NRMSD value24 (same definition as in the DichroWeb16 server) as a function of scale factor, along with the associated values for the calculated secondary structure fractions. (4) Ribbon diagrams for proteins with similar secondary structure compositions (but not necessarily the same folds) as the proteins.

Fig. 6