
FIGURE 1.
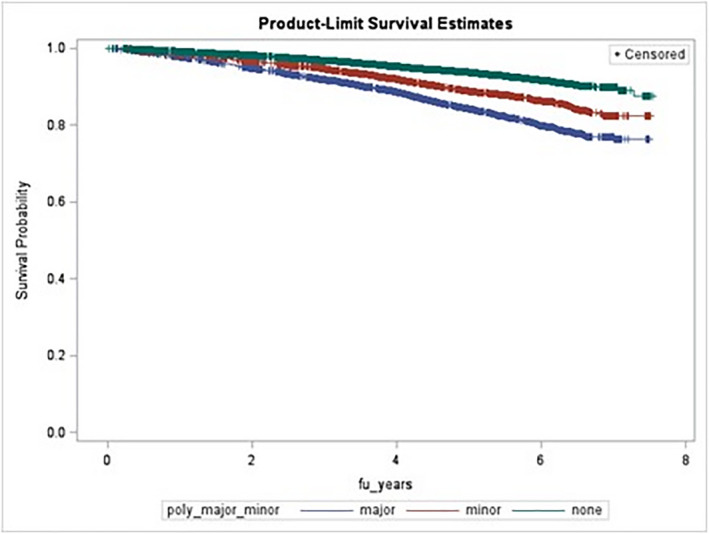
Kaplan–Meier all‐cause‐mortality plot according to polypharmacy status (no polypharmacy [green], minor [red], and major [blue]). Log rank p < .0001. fu_years, follow‐up years
Official websites use .gov
A
.gov website belongs to an official
government organization in the United States.
Secure .gov websites use HTTPS
A lock (
) or https:// means you've safely
connected to the .gov website. Share sensitive
information only on official, secure websites.
Kaplan–Meier all‐cause‐mortality plot according to polypharmacy status (no polypharmacy [green], minor [red], and major [blue]). Log rank p < .0001. fu_years, follow‐up years