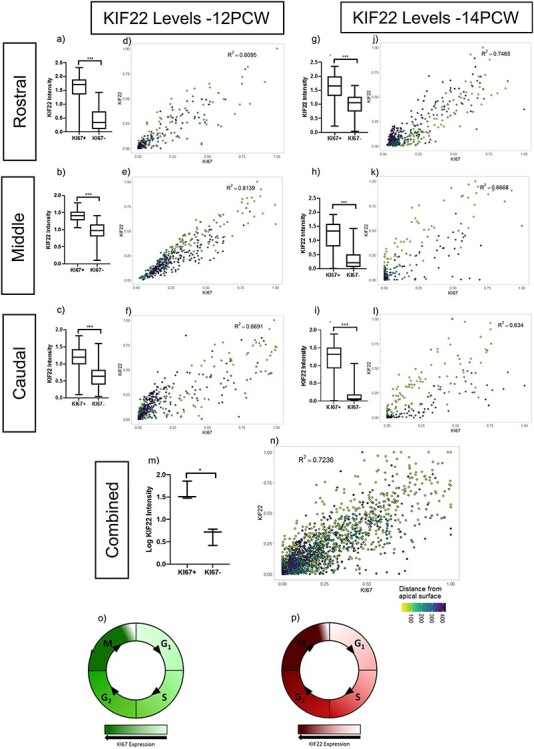
Figure 5 .

Quantification of KIF22 protein levels. (a, b, c) 12 PCW quantification of KIF22 fluorescence intensity in KI67+/KI67- cells (raw data transformation = +1(log), unpaired t-test with Welch’s correction,P = < 0.001). (d, e, f) intensity correlations of KIF22 and KI67 nuclear fluorescence intensity at 12 PCW. (g, h, i) 14 PCW quantification of KIF22 fluorescence intensity in KI67+/KI67- cells (raw data transformation = +1(log), unpaired t-test with Welch’s correction, P = < 0.001). j, k, l) intensity correlations of KIF22 and KI67 nuclear fluorescence intensity at 14 PCW. m) quantification of KIF22 fluorescence intensity in KI67+/KI67-cells 12 and 14 weeks combined (raw data transformation = (log), paired t-test, P = 0.0122). n) intensity correlations of KIF22 and KI67 nuclear fluorescence intensity for rostral-caudal points at 12 and 14 PCW with distance from apical surface indicated by dot color. o) diagram of KI67 protein levels throughout the cell cycle. p) model based on our results of KIF22 protein levels throughout the cell cycle.
