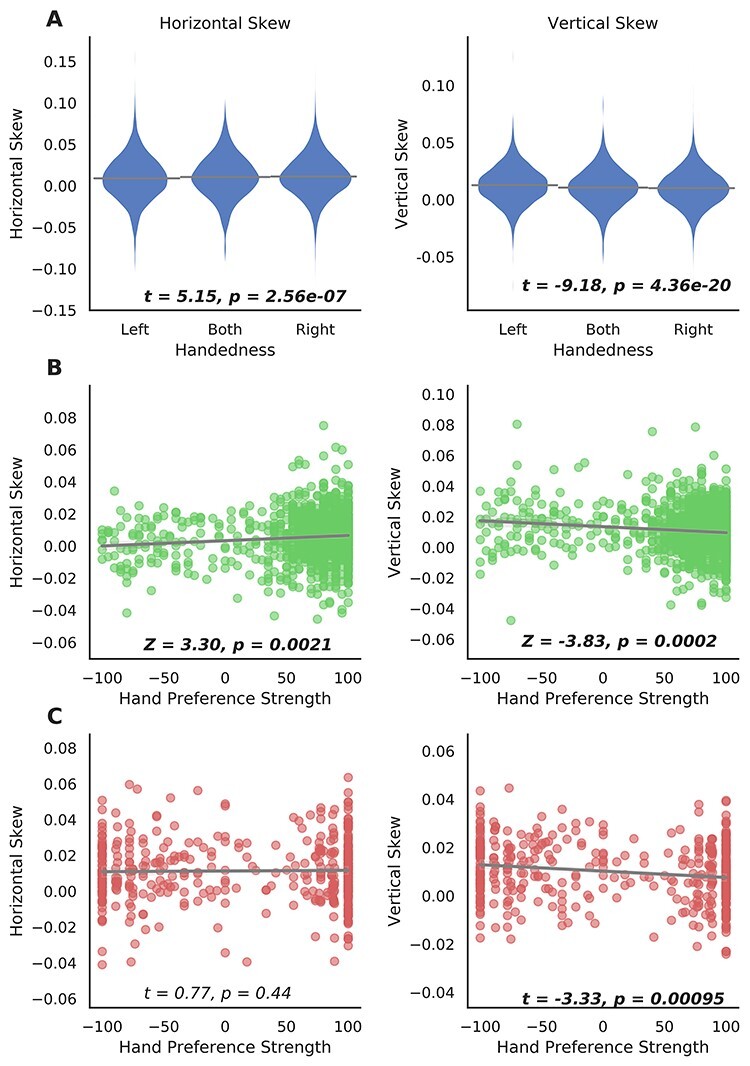
Figure 3 .

Global asymmetry skews and hand preference. (A) Differences in global asymmetry measures between handedness groups in the UK Biobank. (B) Scatter plots of global asymmetry measures and hand preference strength in the HCP. (C) Scatter plots of global asymmetry measures and hand preference strength in BIL&GIN. Note that the statistical tests of association were based on analyses with covariate effects being controlled for, whereas data are plotted here without adjusting for covariates, for display purposes.
