
Figure 5 .
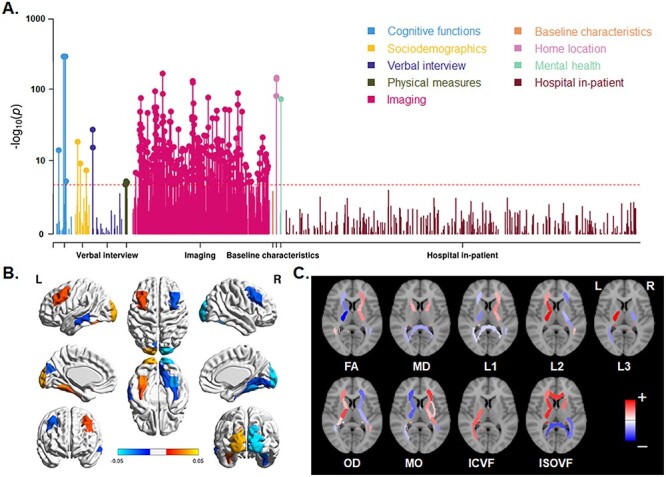
Phenome-wide association analysis for vertical brain skew. (A) Manhattan plots for the associations. Red lines indicate the Bonferroni corrected threshold (P < 1.40e−05). (B) Significant associations of skew measures with regional gray matter volumes. Red–yellow indicates a positive association; blue indicates a negative association. (C) Significant associations of skews with various white matter metrics. Red indicates a positive association; blue indicates a negative association. The per-region names and statistics for parts (B) and (C) can be found in Supplementary Dataset S2. FA: fractional anisotropy, MD: mean diffusivity, L1/L2/L3: the 3 eigenvalues of diffusion, MO: mode of anisotropy, OD: orientation dispersion, ICVF: intra-axonal volume fraction, ISOVF: isotropic volume fraction.