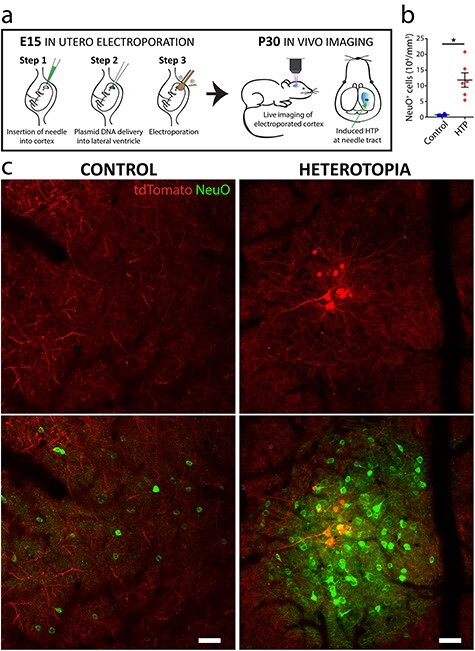
Figure 1 .

Targeted induction and high-resolution imaging of layer I heterotopia in the live mouse. (a) Diagram showing a single neocortical heterotopion induced at the needle tract during in utero electroporation (IUE) at embryonic day (E15). The site is relocated postnatally for detailed investigation of the resulting layer I heterotopion by intravital imaging. (b) Quantification showing significantly increased neuron density (n = 6 mice) within heterotopia compared with ipsilateral neighboring layer I control regions (Wilcoxon nonparametric, matched-pairs signed rank test *P < 0.05). Each point represents the heterotopion or control region from one animal. Horizontal lines and error bars denote mean and SEM, respectively. Descriptive statistics are indicated in Supplementary Table 1. (c) in vivo fluorescence images of a representative layer I heterotopion (right) and neighboring ipsilateral, noninjected control region in a P30 mouse (left). Notice the tightly packed cluster of fluorescently labeled neuronal cell bodies (NeuO; green). Neurons within the heterotopion can also be readily labeled during the electroporation procedure and visualized in vivo (tdTomato; red). In contrast, neurons in more sparsely populated control layer I regions never demonstrate IUE-mediated labeling (left column). HTP, heterotopia. Scale bars, 50 μm (c).
