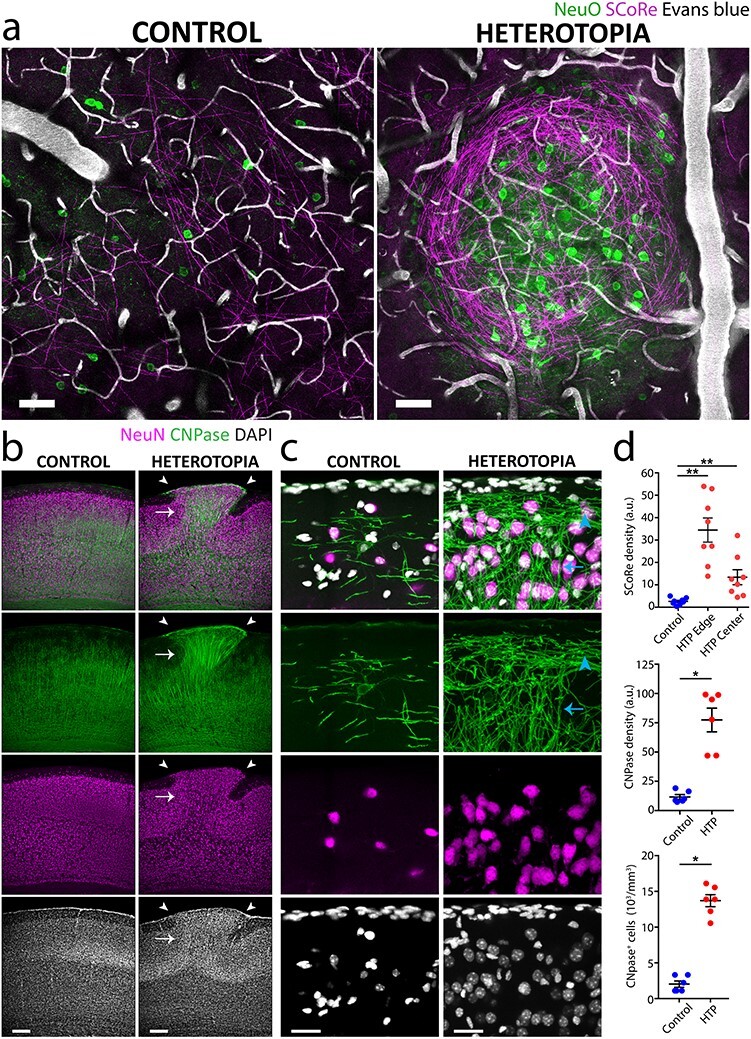
Figure 2 .

Heterotopia contain an abundance of myelinated axons. (a) In vivo combined fluorescence and label-free SCoRe myelin images of a representative induced heterotopion (right; same as in Fig. 1c) and neighboring ipsilateral, noninjected control region (left) in a P30 mouse. The tightly packed heterotopic neuronal cell bodies (NeuO) are surrounded by a circumscribed abundance of aberrantly projecting, myelinated axon segments (SCoRe). (b, c) Low magnification (b) and high magnification (c) immunostainings of an induced heterotopion and its corresponding contralateral control region taken from a P30 mouse, showing increased oligodendrocyte CNPase expression associated with the heterotopion, as defined by the ectopically positioned NeuN+ neuronal cell bodies in layer I (b, white arrowheads). Notice the more horizontal orientation of myelin segments located closer to the pial surface of the heterotopion (c, blue arrowhead). Deeper myelin segments, in contrast, are organized in a more radial fashion (c, blue arrow) and fasciculate into densely myelinated fiber bundles that project through lower cortical layers (b, white arrow). (d) Quantifications of SCoRe in vivo (n = 8 mice; top) and CNPase in fixed tissue (n = 6 mice; middle and bottom), showing increased myelination and oligodendrocyte cell body densities in induced layer I heterotopia compared with noninjected contralateral control regions. Each point represents the layer I heterotopion or control region from one animal. Horizontal lines and error bars denote mean and SEM, respectively (Wilcoxon matched-pairs signed rank nonparametric test; *P < 0.05, **P < 0.01). HTP, Heterotopia. Descriptive statistics are given in Supplementary Table 1. Scale bars, 50 μm (a), 200 μm in (b), and 50 μm (c).
