Figure 6 .

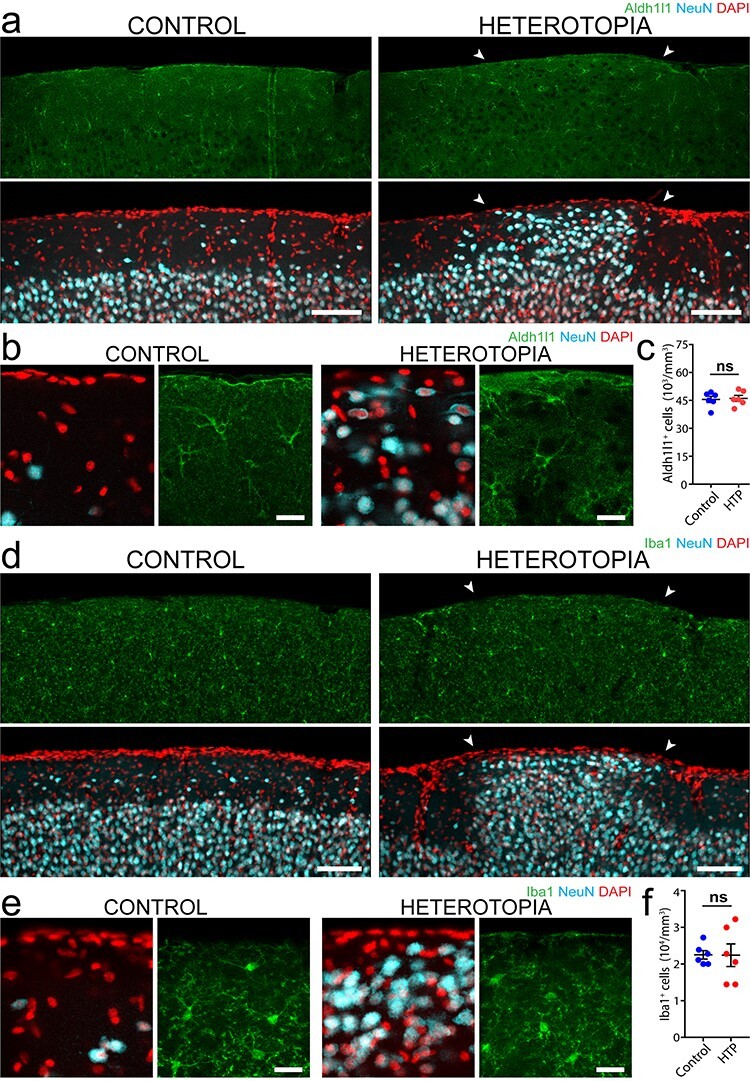
Astrocytes and microglia retain a normal density despite aberrant axonal and myelin distribution. (a, b) Low-magnification (a) and high-magnification (b) images of Aldh1l1-positive astrocytes in P30 mouse cortex, showing similar cell densities in layer I heterotopia (right images, arrowheads) compared with corresponding contralateral control regions (left images). (c) Quantifications using P30 mouse forebrain tissue showing no significant difference in astrocyte cell density (Wilcoxon nonparametric matched-pairs, signed rank test, n = 6 animals; ns, no significance). (d, e) Low-magnification (d) and high-magnification (e) images of Iba1-immunolabeled P30 mouse forebrain, showing no difference in microglia cell densities between heterotopia (right images, arrowheads) and contralateral control regions (left images). (f) Quantifications using P30 mouse forebrain tissue demonstrating no significant difference in microglia cell density between layer I heterotopia and corresponding contralateral control regions (Wilcoxon matched-pairs, signed rank nonparametric test, n = 6 animals; ns, no significance). For graphs in (c) and (f), each point represents an embryonically induced layer I heterotopion or control region from one animal, with horizontal lines and accompanying error bars denoting mean and SEM, respectively. Descriptive statistics are given in Supplementary Table 1. HTP, heterotopia. Scale bars, 100 μm (a), 20 μm (b), 100 μm (d), and 20 μm (e).
