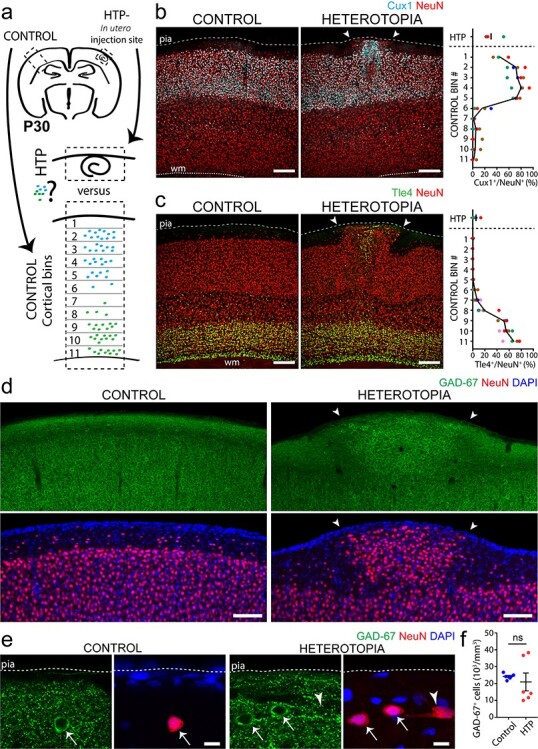
Figure 7 .

Heterotopia contain a mixed population of excitatory and inhibitory neurons. (a) Approach for quantifying layer-specific neuronal marker expression (symbolized by blue and green dots) in layer I heterotopia and across corresponding contralateral control cortices in P30 mice. Contralateral control cortices are subdivided into 11 equally sized bins that together span the entire thickness of the cortex. (b, c) Both Cux1+ (b, cyan) and Tle4+ (c, green) neuronal cell bodies occur within layer I heterotopia (right images, arrowheads). In contralateral control regions (left images), Cux1 is concentrated in more superficial cortical areas corresponding to layers II/III, whereas deeper areas corresponding to layers V/VI encapsulate the majority of Tle4 labeling. Quantifications (far right) show the percentages of NeuN+ cell bodies that also express Cux1 (top) or Tle4 (bottom) within heterotopia and across corresponding contralateral control bins. Each dot corresponds to the layer I heterotopion or control bin of a single animal, with all dots of the same color belonging to the same animal (n = 4 animals for Cux1; n = 5 animals for Tle4). The black line denotes the mean. WM, white matter. d,e Low- (d) and high-(e) magnification z-projections of GAD-67-immunostained P30 mouse forebrain, showing the presence of GAD-67-labeled cells and puncta in both layer I heterotopia (right images, arrowheads) and corresponding contralateral control regions (left images). f, Quantifications from P30 mouse tissue showing no significant difference in GAD-67+ neuronal cell density between layer I heterotopia and contralateral control regions (Wilcoxon matched-pairs, signed rank nonparametric test, n = 6 animals; ns, no significance). Each point represents the layer I heterotopion or contralateral control region from one animal, with horizontal lines and accompanying error bars denoting mean and SEM, respectively. HTP, heterotopia. Descriptive statistics are given in Supplementary Table 1. Scale bars 200 μm (b, c), 100 μm (d), and 10 μm (e).
