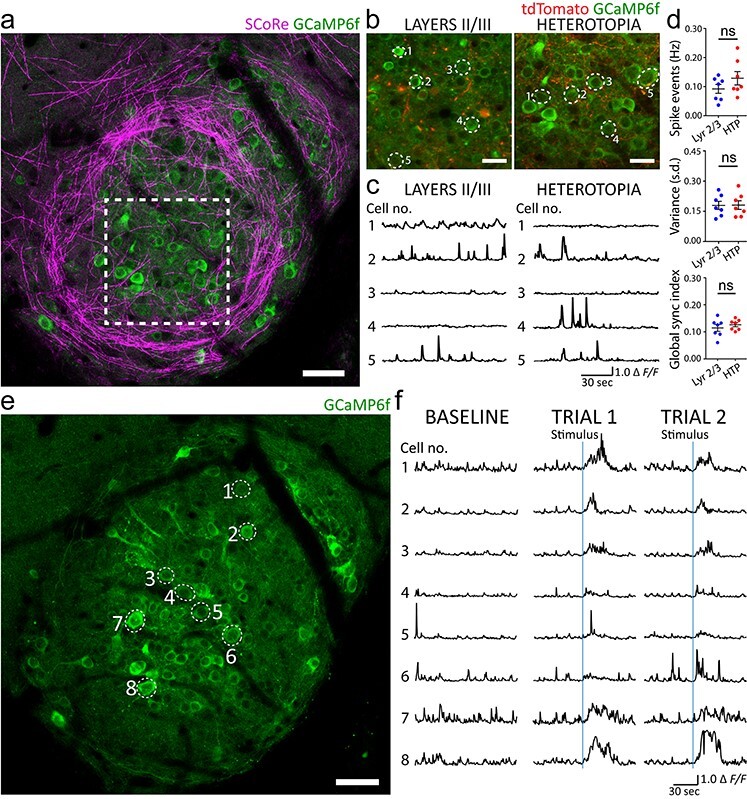
Figure 8 .

Heterotopic neurons display calcium dynamics similar to adjacent layer II/III neurons and respond to sensorimotor input. (a–c) In vivo time-lapse imaging of layer I heterotopic neurons expressing the calcium sensor GCaMP6f in an awake, head-fixed mouse. Dotted lines in (a) indicate an analyzed heterotopic region that is displayed in (b). (c) Example traces of spontaneous neuronal calcium transients from layer I heterotopic (right) and ipsilateral layer II/III nonheterotopic (left) regions displayed in (b). (d) Quantifications showing no significant difference in calcium spike event frequency (Hz), variance (SD), or global synchronization index between layer I heterotopia and adjacent layer II/III nonheterotopic regions. Each dot corresponds to the average value for each measure in a layer I heterotopion or nonheterotopic layer II/III region from a single animal. Data represent 493 layer I heterotopic neurons and 594 layer II/III neurons from n = 7 mice. Wilcoxon matched-pairs, signed rank nonparametric test was used for all three quantifications; ns, no significance; HTP, heterotopia. Descriptive statistics are given in Supplementary Table 1. (e) In vivoz-projection of the same GCaMP6f-transfected heterotopion displayed in (a), captured at a different depth, showing neurons that were imaged during brief applications of whisker stimulation. (f) Baseline calcium dynamics (left column) and calcium fluctuations (middle and right columns) of individual heterotopic neurons in response to stimuli (denoted by solid blue line in two trials) obtained from the awake, head-fixed mouse imaged in (e). Experimental observations in (e, f) were replicated in three mice. All data and images from (a–f) were obtained from P50 to P60 mice with heterotopia induced at E15 and virally transfected with AAV-GCaMP6f at P21-P30. Some neuronal cell body and axonal labeling by pCAG-TdTomato (red) is the result of E15 IUE-mediated transfection. Scale bars, 50 μm (a), 25 μm (b), and 50 μm (e).
