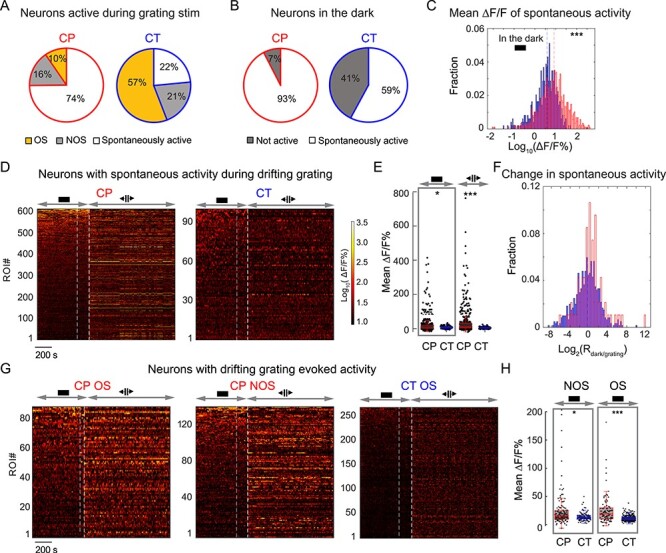
Figure 4 .

V1 L6 CP neurons exhibit pervasive spontaneous activity. (A) Percentages of active CP and CT neurons with spontaneous activity, drifting-grating-evoked OS, and drifting-grating-evoked NOS responses, respectively, during grating stimulation. (B) Percentages of spontaneously active neurons in the dark. (C) Histogram distributions of mean ∆F/F% of spontaneously active CP (red) and CT (blue) neurons in the dark. (D) Raster plots of calcium transients (ΔF/F%) for CP and CT neurons with spontaneous activity both in the dark and during subsequent drifting grating stimulation. (E) Scatter plots of mean ∆F/F% for neurons in (D). (F) Histogram distributions of the ratios of mean ∆F/F% in the dark and under grating stimuli (Rdark/grating) for CP (red) and CT (blue) neurons in (D). (G,H) Raster plots of calcium transients (ΔF/F%) (G) and scatter plots of mean ∆F/F% for CP (red) and CT (blue) neurons with visually-evoked activity (H). Wilcoxon rank-sum test: *P < 0.05 and ***P < 0.001.
