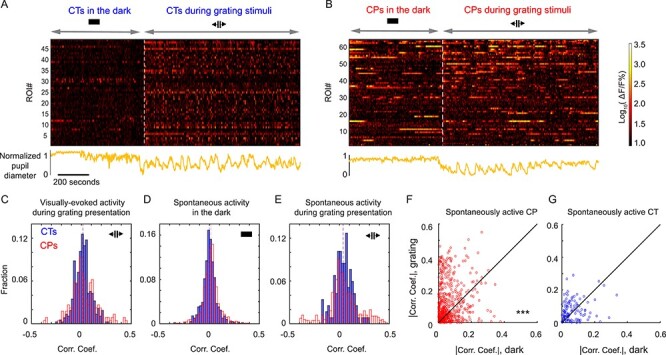
Figure 5 .

Activity of L6 CT and CP neurons shows distinct patterns of correlation with arousal level. (A,B) (Upper) Raster plots of calcium activity (ΔF/F%) of CT (A) or CP (B) neurons from two example FOVs recorded in the dark and during drifting grating visual stimulation. (Lower) Normalized pupil diameter (orange) recorded during the imaging sessions. (C) Histogram distributions of correlation coefficients between pupil diameter and drifting-grating-evoked activity for CT and CP neurons. (D) Histogram distributions of correlation coefficients between pupil diameter and spontaneous activity in the dark for CT and CP neurons. (E) Histogram distributions of correlation coefficients between pupil diameter and spontaneous activity during drifting grating stimulation. Dashed lines indicated medians for each population. (F,G) Scatter plots showing the absolute values of correlation coefficients measured in the dark against those measured during drifting grating stimulation for the same CP (F) and CT (G) neurons. Wilcoxon signed-rank test: ***P < 0.0001 for (F) and P = 0.082 for (G).
