

Abstract
The BOLD fMRI response in the cortex is often assumed to reflect changes in excitatory neural activity. However, the contribution of inhibitory neurons to BOLD fMRI is unclear. Here, the role of inhibitory and excitatory activity was examined using multimodal approaches: electrophysiological recording, 15.2 T fMRI, optical intrinsic signal imaging, and modeling. Inhibitory and excitatory neuronal activity in the somatosensory cortex were selectively modulated by 20-s optogenetic stimulation of VGAT-ChR2 and CaMKII-ChR2 mice, respectively. Somatosensory stimulation and optogenetic stimulation of excitatory neurons induced positive BOLD responses in the somatosensory network, whereas stimulation of inhibitory neurons produced biphasic responses at the stimulation site, initial positive and later negative BOLD signals, and negative BOLD responses at downstream sites. When the stimulation duration was reduced to 5 s, the hemodynamic response of VGAT-ChR2 mice to optogenetic stimulation was only positive. Lastly, modeling performed from neuronal and hemodynamic data shows that the hemodynamic response function (HRF) of excitatory neurons is similar across different conditions, whereas the HRF of inhibitory neurons is highly sensitive to stimulation frequency and peaks earlier than that of excitatory neurons. Our study provides insights into the neurovascular coupling of excitatory and inhibitory neurons and the interpretation of BOLD fMRI signals.
Keywords: BOLD, excitatory neurons, inhibitory neurons, neurovascular coupling, optogenetic fMRI
Introduction
Blood oxygenation level-dependent (BOLD) functional MRI (fMRI) is widely used to noninvasively map brain function in humans and animals. However, BOLD fMRI is an indirect index of neuronal activity (Kim and Ogawa 2012), and thus understanding its neural correlates is critical to the proper interpretation of fMRI. Increases and decreases in the BOLD response are often assumed to reflect increases and decreases (deactivation) in excitatory neural activity (Logothetis et al. 2001; Logothetis 2008), respectively, because excitatory neurons constitute 80–90% of all neurons in the cortex (Meyer et al. 2011). The remaining neurons transmit γ-aminobutyric acid (GABA) to inhibit postsynaptic neurons, playing a critical role in cortical processing. Because inhibitory neurons also connect to nearby arterial vasculature (Vaucher et al. 2000; Kocharyan et al. 2008), they are involved in evoked hemodynamic regulation (Cauli et al. 2004; Cauli and Hamel 2010). Thus, it is crucial to examine how inhibitory neurons affect hemodynamic responses and BOLD fMRI.
Hemodynamic responses to inhibitory neural activity have been investigated in GABAergic neuron-rich brain regions (Mathiesen et al. 1998; Poplawsky et al. 2015; Poplawsky et al. 2021) or by selectively activating inhibitory neurons (Anenberg et al. 2015; Uhlirova et al. 2016; Vazquez et al. 2018; Dahlqvist et al. 2020; Krawchuk et al. 2020; Lee, Stile, et al. 2021; Lee, Boorman, et al. 2020). Synaptically activated inhibitory neurons induce a blood flow increase in inhibitory neuron-rich regions, such as the cerebellar cortex (Mathiesen et al. 1998) and olfactory bulb (Poplawsky et al. 2015; Poplawsky et al. 2021), indicating that inhibitory neuronal activity induces a positive BOLD response. Alternatively, in the cortical area, where excitatory and inhibitory neurons are intermingled, optogenetics can be used to selectively stimulate inhibitory neurons (Zhao et al. 2011). After light-sensitive channelrhodopsin-2 (ChR2) ion channels were genetically targeted to inhibitory neurons, hemodynamic responses to increased inhibitory activity were examined with intrinsic optical imaging or laser Doppler flowmetry (Anenberg et al. 2015; Uhlirova et al. 2016; Vazquez et al. 2018; Dahlqvist et al. 2020; Krawchuk et al. 2020; Lee, Stile, et al. 2021; Lee, Boorman, et al. 2020). In general, activating interneurons that target the vesicular GABA transporter (VGAT) increased cerebral blood flow (CBF) and cerebral blood volume (CBV) (Anenberg et al. 2015; Uhlirova et al. 2016; Vazquez et al. 2018; Krawchuk et al. 2020), which would be expected to induce positive BOLD signals. However, because inhibitory and excitatory neurons interact closely within the same region (Taniguchi 2014), an increase in inhibitory activity decreases nearby excitatory neuronal activity. Thus, interpreting the hemodynamic responses induced by optogenetic stimulation of inhibitory neurons is complicated. Additionally, BOLD fMRI has a complex dependency on changes in the CBF, CBV, and cerebral metabolic rate of oxygen metabolism (CMRO2) (Kim and Ogawa 2012). Thus, CBF or CBV responses measured by optics (Anenberg et al. 2015; Uhlirova et al. 2016; Vazquez et al. 2018; Dahlqvist et al. 2020; Krawchuk et al. 2020; Lee, Stile, et al. 2021; Lee, Boorman, et al. 2020) might not be directly translatable to BOLD fMRI. Consequently, it is important to clarify how inhibitory and excitatory neurons affect BOLD fMRI signals.
In this study, we examined the effects of inhibitory and excitatory neuronal activity on neurovascular coupling and BOLD fMRI using inhibitory and excitatory ChR2 mouse models. First, neuronal activity was measured using electrophysiological recordings from the primary somatosensory cortex during ChR2 stimulation of transgenic VGAT-ChR2 and CaMKII-ChR2 mice. To modulate the magnitude of inhibitory and excitatory neuronal activity via light stimulation, two different stimulation frequencies were chosen. Second, BOLD fMRI signals were acquired at an ultrahigh field of 15.2 T to observe local and distant responses to the optogenetic stimulation with a high signal-to-noise ratio, and then they were compared with those from forepaw stimulation. To enable a comparison with published optical imaging data with a relatively short stimulation duration (1–4 s) and examine the stimulation-duration dependency, CBV- and BOLD-weighted optical intrinsic signal imaging (OISI) was performed for 5 and 20-s optogenetic stimulation in VGAT-ChR2 mice. Last, modeling of the hemodynamic response function (HRF) was performed from neuronal and hemodynamic data of the somatosensory cortex.
Materials and Methods
Animal Subjects
Inhibitory neuron-specific VGAT-ChR2-EYFP (B6.Cg-Tg(Slc32a1-COP4*H134R/EYFP)8Gfng/J) transgenic mice (20–29 g, both sexes, 9–15 weeks old; n = 17), and wild-type C57BL/6 mice (22–31 g, both sexes, 8–20 weeks old, n = 11) were used (Table 1). All transgenic mice were bred in-house from breeding pairs originally acquired from Jackson Laboratory (Bar Harbor). Animals were housed in cages under a 12-h dark–light cycle, and food and water were provided ad libitum. All procedures were approved by the Institutional Animal Care and Use Committee of Sungkyunkwan University in accordance with standards for humane animal care from the Animal Welfare Act and the National Institutes of Health Guide for the Care and Use of Laboratory Animals.
Table 1.
Summary of animal groups and associated experiments
| Group | # of animals used | Stimulation (frequency in Hz) | Experiment |
|---|---|---|---|
| VGAT-ChR2 | N = 17 | Optogenetic frequency-dependence (1/4/10/20/40) | Electrophysiology |
| Optical (1/20) | Electrophysiology/fMRI/OISI | ||
| Forepaw (4) | Electrophysiology | ||
| CaMKII-ChR2 | N = 6 | Optical (1/20) | Electrophysiology/fMRI |
| Forepaw (4) | fMRI | ||
| Control | N = 5 | Optical (1/20) | fMRI or OISI |
Note: The number of animals used in each group is shown with corresponding experiments and stimulation types. fMRI, functional magnetic resonance imaging; OISI, optical intrinsic signal imaging.
Virus Injection, Optical Fiber Implantation, and Thinned Skull Preparation
Fiber implantation and virus injection were performed under ketamine (100 mg/kg) and xylazine (10 mg/kg) >2 weeks before the experiments. Meloxicam (1 mg/kg) was additionally administered subcutaneously to relieve pain and reduce inflammation. Mice were fixed to a stereotaxic frame, and the scalp was cut out in a large oval shape to expose the whole skull. Then, craniotomy and durotomy (~0.5-mm diameter) were performed on the right primary somatosensory cortex, forelimb area (S1FL; 0.05-mm posterior from the bregma and 2.2-mm lateral). We injected AAV5-CaMKIIα-hChR2(H134R)-EYFP (6 mice for the CaMKII optogenetic experiments) or AAV9-CaMKII-GCaMP6f-WPRE-SV40 (one animal for testing OISI) (obtained from the University of North Carolina Vector Core) into the wild-type mice. We loaded the virus into a glass pipette (BF-120-60-10, Sutter Instrument) and connected it to a pressure injector (PICOSPRITZER III, Parker Hannifin). Then, we attached them to a micromanipulator (SMX, Sensapex) in the stereotaxic arm. After placing the glass pipette at the target point, we slowly inserted the pipette to a depth of 500 μm and injected 500 nl of the virus at a pressure of 20 psi.
For the fMRI animal groups, an optical fiber cannula with a core diameter of 105 μm and a numerical aperture of 0.22 (CFMLC21L02, Thorlabs), chosen to minimize MRI distortion, was implanted at a depth of 0.5 mm. The fiber was fixed using a small amount of bio-compatible silicone adhesive (Kwik-Cast, World Precision Instrument). Then, dental cement (Super-Bond, Sun Medical) was thinly spread over the whole skull to fix the fiber cannula onto the skull.
For wide-field OISI of VGAT-ChR2 mice, thinned skull mice were prepared 1 week before the experiment under 2% isoflurane anesthesia. Similar to the virus injection procedure, animals were fixed to a stereotaxic frame, and the entire dorsal skull was carefully exposed with forceps and surgical scissors. After removing the thin periosteum, the skull was thinned with a handheld drill, and then a thin layer of cyanoacrylate glue (Loctite 401, Henkel) was applied to the entire skull surface to achieve optical clarity.
Experimental Design and Stimulus Paradigms
The mice were initially anesthetized with 4% isoflurane in oxygen, and then a mixture of ketamine (100 mg/kg) and xylazine (10 mg/kg) was injected intraperitoneally (IP) to induce anesthesia. Supplementary anesthesia (25 and 1.25 mg/kg for ketamine and xylazine, respectively) was delivered repeatedly via an IP line as needed, based on physiological monitoring (Shim et al. 2018). For the neuronal recording and OISI studies, each mouse’s head was fixed in a stereotaxic frame (SR-10R, Narishige). For the fMRI studies, each animal was positioned in a customized mouse cradle, and the head was fixed with ear and bite bars. Silicone adhesive (Kwik-Cast, World Precision Instrument) was used to cover the eyes and dental cement on the head to prevent light leakage. During the experiments, body temperature was kept at ~37 °C using an electric or hot-water heating pad. Supplementary oxygen was delivered continuously via blow-by at a rate of 0.35 L/min, or oxygen-rich air (a mixture of oxygen and air at a 1:4 ratio) was ventilated at a rate of 1 L/min through a tightly fitted nose cone using a small animal ventilator (SAR-1000, CWE or TOPO, Kent Scientific Corporation) to maintain an oxygen saturation level of >90% (Shim et al. 2020). The animals’ heart and respiration rates were continuously monitored throughout the experiments with an animal monitoring system (Physiosuite, Kent Scientific Corporation or Model 1030, Small Animal Instruments) and recorded with a data acquisition system (Acknowledge, Biopac Systems).
The stimulation parameters were controlled by a pulse stimulator (Master 9, World Precision Instruments). For optical stimulation, the light was delivered to the brain via an optical fiber cable connected to the fiber cannula (105 μm for fMRI/electrophysiology, 200 μm for optical imaging). The optical stimulus was generated by a blue laser (MBL-III-473, Changchun New Industries Optoelectronics Tech.) with a wavelength of 473 nm and a laser power of 3 mW at the tip of the fiber, as measured with a power meter (PM100D, Thorlabs). The duty cycle was fixed to 20% for every stimulation paradigm to keep the total amount of light power deposition consistent (equivalent to 69.3 or 15.8 mW/mm2). For forepaw stimulation, a pair of 30 G needle electrodes was inserted beneath the skin of the left forepaw. The electrical stimulus was controlled by a current generator (ISO-Flex, AMPI); it had a current intensity of 0.5 mA and was delivered at 4-Hz frequency with a 0.5-ms pulse width (Shim et al. 2018).
Three experimental designs were used (Table 1). 1) To determine the stimulation frequencies for the fMRI studies of optogenetic stimulation in VGAT-ChR2 mice, electrophysiological recordings were performed for 10 (baseline), 10 (stimulation), and 10 s (rest). The light stimulus was delivered with the following parameters: 1 (frequency)/200 (pulse width), 4/50, 10/20, 20/10, and 40 Hz/5 ms. 2) For the rest of the electrophysiology and fMRI studies, the stimulation paradigm consisted of five blocks: 40 (baseline), 20 (stimulation), 60 (rest), 20 (stimulation), and 60 s (rest). The light stimulus was delivered with the following parameters: 1/200 and 20 Hz/10 ms. 3) For the OISI studies of 1/200 and 20 Hz/10 ms stimulation of VGAT-ChR2 mice, the stimulation paradigms consisted of 5 (baseline), 5 or 20 (stimulation), and 20 or 40 s (rest). Control experiments were performed on one wild-type mouse and one CaMKII-GCaMP6f mouse.
Electrophysiology
Each mouse scalp was removed to expose the skull. After cleaning the skull, two holes with diameters of ~0.3 mm were made using a dental drill to insert ground and reference screws. A craniotomy was performed over the right S1FL (2.2-mm lateral, 0.05-mm anterior from the bregma) in a diameter of ~2 mm and a wall (~3-mm diameter) centering the right S1FL was made with dental composite resin (Charmfil Flow, Dentkist). We then performed the CBV-weighted OISI (Imager 3001, Optical Imaging Ltd.) in response to left forepaw stimulation to precisely determine the right S1FL. For simultaneous recording and light stimulation, a 16-channel opto-electrode with 50-μm spacings between channels (A1x16-5 mm-50-177-OA16LP, NeuroNexus) was placed at the center of the predetermined S1FL and driven down at a speed of 1 μm/s until the electrode tip reached a depth of 1 mm (Fig. 1A). Then, the wall was filled with saline. After we waited >10 min to allow the tissue to settle, electrophysiological recording was performed at a sampling rate of 30 kHz using a neural data acquisition system (Cerebus™, Blackrock Microsystems).
Figure 1 .

Experimental schemes and plans. (A–C) Schematic of the 16-channel electrode, fMRI, and OISI setups, respectively. (D) Fluorescence microscopic image showing the expression of ChR2-EYFP in S1FL (blue: DAPI; green: EYFP). (E) A representative anatomical MR image obtained with the FLASH sequence. (F) A representative functional MR image obtained with the EPI sequence.
MRI Experiments
All MRI data were acquired on a 15.2 T/11 cm MR scanner (Bruker BioSpec) with an actively shielded 6-cm gradient coil operating with a maximum strength of 100 G/cm and a rise time of 110 μs. A customized single-loop elliptic surface coil (15  12 mm2) was placed on top of each mouse head and used for RF transmission and reception (Fig. 1B). Anatomical images were acquired using the fast low-angle shot (FLASH) sequence with the following parameters: field-of-view (FOV) = 16 (readout, x-axis)
 8 (phase encoding, y-axis) mm2, matrix size = 256
  128, in-plane resolution = 62.5
  62.5 μm2, 21 contiguous coronal slices with a slice thickness of 250 μm, sampling bandwidth = 50 kHz, repetition time (TR) = 310 ms, echo time (TE) = 3 ms, and flip angle (FA) = 30
 . For BOLD fMRI, we used the single-shot gradient-echo echo-planar imaging (GE-EPI) sequence with the following parameters: FOV = 15 (readout, x-axis)
 7.5 (phase encoding, y-axis) mm2, matrix size = 96
  48, in-plane resolution = 156
  156 μm2, 9 contiguous coronal slices with a slice thickness of 500 μm, sampling bandwidth = 300 kHz, TR = 1000 ms, TE = 11.5 ms, and FA = 50
 . The FOV was placed to cover the somatosensory-related areas, and then local shimming was performed based on the field map to minimize field inhomogeneity within the elliptic shim volume inside the brain. To alleviate aliasing effects along the phase encoding direction, slab saturation was performed at the ventral side of the brain with a thickness of 5 mm before each volume acquisition.
Multi-Wavelength OIS Imaging
OISI under optogenetic stimulation was performed with a home-built system (Fig. 1C), similar to that of Bauer et al. (2018). Two TTL-controlled light-emitting diodes centered at 530 nm (the isosbestic point of hemoglobin; CBV-weighted) and 625 nm (sensitive to deoxyhemoglobin; BOLD-weighted) (M530L4 and M625L4 coupled with LEDD1B) alternatively illuminated the thinned-skull and were interleaved with the optogenetic stimulation. An sCMOS digital camera (Andor Zyla 4.2, Oxford Instruments) was mounted on an epi-fluorescence microscope equipped with a 1× (0.25 NA) objective (MVX-10; Olympus). To prevent the saturation of the camera by the reflected photo-stimulus at 473 nm, a dichroic mirror with a cutoff wavelength of 485 nm (DM485, Olympus) was placed in front of the camera. Hardware was controlled via a data acquisition card (Arduino board) and a personal computer running home-written software.
For the OISI studies, the left primary forelimb area was found by acquiring OISs in response to right forepaw stimulation; 530- and 625-nm reflected optical images were acquired over a 13 × 13 mm2 FOV with a 2048 × 2048 matrix size at 10 frames per second. For each stimulation paradigm, at least 15 trials were obtained.
Histology
To determine whether virus-injected ChR2 with yellow fluorescent proteins was expressed in S1FL of the CaMKII-ChR2 mice, histological confirmation was performed. After the completion of all necessary experiments, the mice were deeply anesthetized with ketamine/xylazine. Saline solution and 4% formaldehyde (PFA) were transcardially perfused, and then the brain was extracted and postfixed in 4% PFA overnight at 4 °C. The brains were stabilized with 30% sucrose in 0.1 M phosphate-buffered saline (PBS; pH 7.4) for 3 days. Then, the brains were sectioned coronally with a cryostat (CM1950, Leica Biosystems) at a 40-μm thickness, and the sections containing the fiber implantation sites were preserved in 0.1 M PBS for fluorescence imaging. Sections were mounted with DAPI (4′6-diamidino-2-phenylindole)-containing mounting medium (VECTASHIELD H-1500, Vector Laboratories), which labels all cellular nuclei regardless of cell type. Images were acquired using a fluorescence microscope (DMi8, Leica Microsystems).
Data Analysis
Multi-Unit Activity Analysis
Electrophysiological data were analyzed using Matlab (Mathworks). The raw data were bandpass filtered (0.3–6 kHz) first. The common noise level across 16 channels was determined at each time point, and then data from the 8 channels closest to the mean value were averaged at each time point (MATLAB trimmean) (Guo et al. 2014). The filtered time course after subtraction of the common noise time course was obtained for each channel, and its temporal mean and standard deviation (SD) were computed for each channel. Peaks exceeding 5 SD from the mean for each channel were considered to be spikes. The number of spikes was quantified and converted into spike frequency.
To characterize the neuronal activity generated by different frequency-dependent stimuli in VGAT-ChR2 mice, the number of spikes was quantified over 1-ms bins. The neuronal activity induced by each light stimulus pulse was obtained by averaging the multi-unit activity (MUA) data over repeated interstimulus periods (from one stimulus onset to the next stimulus onset). Thus, one averaged MUA time course was obtained in each frequency.
To match the neuronal data with the fMRI temporal resolution, the number of spikes was quantified over 1-s bins. 1) In the VGAT-ChR2 studies, optogenetic stimulation induced increased inhibitory activity, which reduced the excitatory activity. Therefore, the MUA activity during the “pulse” period was considered to reflect mostly inhibitory activity. After the light pulse ended, the suppression of excitatory activity was prolonged. Thus, MUA activity during the “inter-pulse” period was computed separately after excluding the initial 10 ms of data immediately after pulse to avoid measuring residual inhibitory activity. During the 20-s stimulation periods, three neuronal time courses were obtained: the pulse period, the interpulse period, and the entire period. 2) For the studies of forepaw stimulation and optogenetic stimulation of excitatory neurons, only total MUA time courses were obtained for entire stimulation periods. To compare the MUA with the BOLD fMRI signals in the somatosensory cortical region of interest (ROI), all 16 channels were averaged.
BOLD fMRI Analysis
All fMRI data were preprocessed and analyzed using readily available software packages: Analysis of Functional NeuroImages (Cox 1996), FMRIB Software Library (Smith et al. 2004), Advanced Normalization Tools (Avants et al. 2011), and Matlab. Each functional image volume was preprocessed with slice timing correction and motion correction by aligning every image to the first image of each first volume. To generate group-averaged datasets, preprocessed data in the same session were averaged, and linear detrending was performed to reduce signal drift. Then, spatial smoothing was performed using a Gaussian kernel with an FWHM of 0.156 mm. Spatial normalization was conducted using the following procedure. First, multislice functional EPI images were co-registered to the anatomical T2*-weighted images from the same subject using an affine transformation. Second, the T2*-weighted images of all subjects were normalized and averaged while applying linear- and nonlinear transformations to generate a mouse brain template. Third, all EPI images co-registered in the first step were normalized to the mouse brain template using the co-registration parameters obtained in the second step. The Allen Mouse Brain Atlas was registered to the brain template.
We excluded one animal from the forepaw data and one from the CaMKII data due to a lack of BOLD responses in the S1FL, resulting in five animals each for the forepaw and optogenetic stimuli. Group-averaged activation maps were made by a GLM analysis using a stimulation paradigm convolved with a gamma-variate function. Activation voxels were decided using a threshold of the t-value (P < 0.05, family-wise error corrected with the Bonferroni post-hoc test) and clusters with >102 voxels (equivalent to 0.1 mm3).
For the quantitative analyses, ROIs were defined based on the Allen Brain Atlas: the upper limb in the primary somatosensory area (S1FL), supplementary somatosensory area (S2), and posterior complex of the thalamus (PO). BOLD time courses were calculated as percent changes relative to the baseline period and extracted from defined ROIs for each subject. Two stimulation blocks, with 10-s prestimulus and 50-s poststimulus periods, were averaged for further analysis, resulting in time courses that had a 10-s baseline, 20-s stimulation, and 50-s rest.
OISI Analysis
To accelerate postprocessing, 4 × 4 binning was performed on the images. Repeated trials were averaged for each stimulation condition. To generate activation maps, a baseline image (R) was obtained by averaging images over the 5-s period prior to stimulation. Differential images (ΔR) were then calculated by subtracting the baseline image from each image in time. Lastly, activation maps (ΔR/R) were generated by dividing the differential images by the baseline image. To remove the contribution of fluorescent signals to OISI for 1-Hz optogenetic stimulation, we excluded data points to be acquired during optogenetic light exposure. Although the acquisition of OISI (10-Hz sampling rate) was interleaved with 20-Hz optogenetic stimulation, stimulus-induced artifacts persisted at the center of illumination at 20 Hz. Hence, we extracted OIS time courses from a c-shaped ROI (outer diameter: 1 mm and inner diameter: 0.5 mm) excluding the location of artifacts and the optic fiber in control and VGAT-ChR2 mice. Then, the magnitude of the residual artifact was estimated from the subtraction of two consecutive time points right at stimulus onset and at stimulus end assuming that the hemodynamic change was minimal, and was subtracted from the raw time courses. Then, CBV- and BOLD-weighted OIS time series were converted into concentration changes of total hemoglobin (HbT), deoxyhemoglobin (HbR), and oxyhemoglobin (HbO) using the following equation based on the Modified Beer–Lambert Law: ,where
  is the change in pathlength-corrected absorption coefficient between time
  and
and  at wavelength
  ,
,  is the molar extinction coefficient of HbR or HbO, and
  is the change in HbR or HbO concentration. We used a pathlength value of 0.57 and 2.50 mm for 530 and 625 nm, respectively, and molar coefficients of 39 707 and 39 016 cm−1 M−1 for HbO and HbR at 530 nm, and 952.8 and 6633.7 cm−1 M−1 for HbO and HbR at 625-nm wavelength, respectively (Dunn et al. 2005).
Relationship between Neuronal Activity and the BOLD/OIS Response in the S1FL ROI
The HRF was obtained using MUA data as input and corresponding BOLD fMRI and OISI data as output. The HRF was modeled as a 2-pole and 1-zero Laplace function that is able to accommodate overshoot and undershoot response characteristics. An amplitude coefficient was also included in the HRF to best match the amplitude and constrain the pole-zero space. The HRF model parameters were estimated with a squared-error minimization procedure in the hemodynamic response prediction, using the MUA data as input convolved with the estimated HRF. For the optogenetic hemodynamic data from the VGAT-ChR2 mice, we also explored a model with two inputs (excitatory and inhibitory neuronal activity) and two HRFs with the individual amplitude coefficients that best predicted the observed response. To avoid potential interactions between HRFs when fitting the 2 HRF model, we constrained the HRF fit parameters to be positive and the first HRF to peak within the first 6 s.
Statistical Analysis
All time courses and bar graphs in this study are presented as mean values and standard errors of the mean (SEMs). Statistical tests were conducted by paired t-test for two sets or one-way repeated analysis of variance (ANOVA) with the Bonferroni post-hoc test to quantify the statistical significance of multiple comparisons (P < 0.05 was considered to be statistically significant).
Results
Confirmation of ChR2 Expression and Fiber Implantation
We first verified ChR2 expression in the S1FL area after injecting AAV5-CaMKIIα-hChR2(H134R)-EYFP. A fluorescence image showed yellow fluorescence (EYFP) locally in the right S1FL (Fig. 1D), which exhibited a pattern similar to that found in a previous study (Watakabe et al. 2015). The location of the implanted fiber cannula was confirmed in MR images, T2*-weighted anatomical (FLASH), and functional images (EPI), from the same animal. The tip of the fiber was placed at a depth of 500 μm, as confirmed in the FLASH image (Fig. 1E). In the EPI image, the depth and size of the fiber were overestimated because of EPI-induced blurring effects (Fig. 1F), but our high-quality images of mouse brains with fiber implantation demonstrated that BOLD responses can be obtained in the S1FL without significant image distortions.
Characterization of MUA Activity in Response to Optogenetic Stimulation of Inhibitory and Excitatory Neurons and Forepaw Stimulation
Electrophysiological recordings were made in the S1FL of VGAT-ChR2-EYFP mice, and all data from 16 channels (at a depth of 200–950 μm) were averaged to determine the general property of frequency dependency. During 10 s of optogenetic stimulation of GABAergic neurons, spontaneous spike activity was suppressed by repeated 20-Hz 10-ms light pulses (Fig. 2A; blue background period), though spikes with smaller amplitudes appeared (Fig. 2A). Spikes were evoked in response to each light pulse (red trace) with a few milliseconds of delay, and they were suppressed after the light pulse ended (Fig. 2B).
Figure 2 .

Stimulation frequency-dependent neuronal activity changes via optogenetic stimulation of VGAT-expressing inhibitory neurons. (A) A representative MUA time course with 20-Hz optogenetic stimulation. The blue shade indicates the stimulation period, and the section between the red dashed lines was expanded for better visualization of MUA activity with each light pulse (red trace) in (B). Appearance of negative skewed neural activity during the stimulation period (blue shade in A) is due to increased inhibitory neuronal activity (red trace in B). (C) Mean MUA responses (averaged across all channels; n = 4 mice) modulated by different stimulation frequencies, represented as red solid lines, each of which shows one pulse period from the onset of one stimulus to the onset of the next stimulus. The blue shade here represents the single stimulus pulse period for each condition, and the black dashed horizontal line is the mean baseline spike activity. The right panel shows only the poststimulus period (indicated by yellow lines) for better visualization of neuronal activity recovery. Blue arrows: time of MUA recovery. In the case of 1 Hz, an arbitrary duration within the postpulse period was omitted.
To observe the temporal pattern of neuronal activity between optogenetic light pulses in detail, group-averaged MUA data from 4 mice were obtained for averaged segments from one pulse onset to the next pulse onset for each optogenetic stimulation frequency (Fig. 2C). Regardless of frequency, the evoked MUA peaked at 5–7 ms after the pulse onset and then adapted rapidly. Spike activity diminished to slightly below the prestimulus baseline level with a pulse duration of 50–200 ms (blue background in Fig. 2C; 1–4 Hz). After the pulse ended, neuronal activity decreased slowly to close to zero (see the right panel in Fig. 2C for an expanded view of the postpulse period), implying that spontaneous spike activity (likely excitatory activity) was suppressed completely while the light was on. Spike activity started to rebound noticeably ~50 ms after the pulse ended (see blue arrows in the right panel of Fig. 2C), so MUA did not recover to the prestimulus baseline level when the interstimulus interval was less than 50 ms (e.g., 20 and 40 Hz). Therefore, we presume that 1) spikes during the pulse periods are induced by ChR2 activation and represent the activity of inhibitory GABAergic neurons, and 2) spikes detected in the baseline period and between stimulus pulses represent mostly excitatory neuronal activity (Li et al. 2019). Based on our frequency-dependent neuronal data, we chose frequencies of 1 and 20 Hz to modulate excitatory and inhibitory neuronal activity in further studies.
Next, we compared the changes in neuronal activity modulated by sensory (forepaw) stimulation and optogenetic stimulation targeting excitatory or inhibitory neurons. Channel-wise MUA time series in response to forepaw 4-Hz, CaMKII 20-Hz, and VGAT 20-Hz stimulation are shown in Figure 3A–C. Forepaw and excitatory stimulation-induced MUA increases in every channel (Fig. 3A,B). However, inhibitory stimulation-induced increased activity in the upper channels (Ch 1–8) and decreased activity in the deeper channels (Ch 9–16; Fig. 3C), likely due to differential contributions from the excitation of inhibitory neurons and suppression of excitatory neurons. Therefore, we separated the MUA responses into two components, pulse and interpulse spikes (Fig. 3C; right panels). Clearly, during 20-Hz optogenetic stimulation in VGAT-ChR2 mice, an increase and a decrease in MUA were visible in the pulse and interpulse periods, respectively.
Figure 3 .
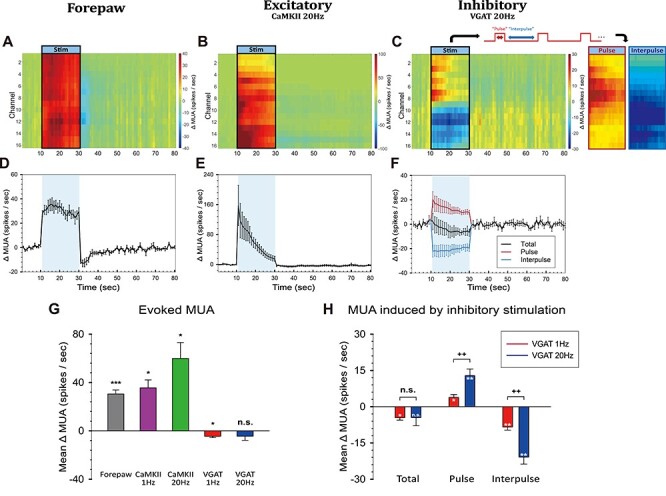
Neuronal activity induced by sensory and optogenetic stimulation of excitatory or inhibitory neurons. (A–C) Depth-dependent MUA responses measured by the 16-channel electrode, and (D–F) averaged MUA responses across channels evoked by forepaw (A and D), excitatory (CaMKII, B and E), and inhibitory (VGAT, C and F) optogenetic stimulation. In (C), MUA activity in the pulse and interpulse periods is separately shown in the right panel, and the averaged mean time courses (n = 5 animals) are plotted in (F). (G) Change in MUA during the 20-s stimulation period for each condition. (H) Changes in Total, Pulse, and Interpulse spike activity induced by inhibitory (VGAT) 1- and 20-Hz stimulation. Error bars, SEM; *, P < 0.05; **, P < 0.01; ***, P < 0.001; n.s., not significant (one-sample t-test in G); ++, P < 0.01; n.s., not significant (paired t-test in H).
When the responses from all channels were averaged, the forepaw and CaMKII 20-Hz responses exhibited a clear increase in spike frequency (Fig. 3D,E), whereas the VGAT 20-Hz response was somewhat ambiguous (Fig. 3F, black line). During stimulation, changes in MUA were 30.50 ± 3.27 spikes/s for the forepaw (n = 5), 35.58 ± 6.54 spikes/s for CaMKII 1 Hz (n = 3), 59.85 ± 13.30 spikes/s for CaMKII 20 Hz (n = 3), −4.55 ± 1.04 spikes/s for VGAT 1 Hz (n = 5), and −4.51 ± 3.36 spikes/s for VGAT 20 Hz (n = 5; Fig. 3G). The VGAT 1- and 20-Hz stimulations (Fig. 3H) did not make much difference in the total number of evoked spikes, but 20-Hz optogenetic stimulation-induced more spikes during the pulse period (12.83 ± 2.76 spikes/s for 20 Hz vs. 3.86 ± 1.19 spikes/s for 1 Hz; P = 0.0074, paired t-test) and fewer spikes during the interpulse period than 1-Hz stimulation (−20.88 ± 2.88 spikes/s for 20 Hz vs. −8.46 ± 1.28 spikes/s for 1 Hz; P = 0.0024, paired t-test; Fig. 3H). Together with the results from CaMKII-ChR2 stimulation, these results indicate that optogenetic stimulation at a higher frequency elicits a larger neuronal response.
BOLD fMRI Responding to Optogenetic Stimulation of Inhibitory and Excitatory Neurons and Forepaw Stimulation
Based on the neuronal activity findings, we obtained BOLD fMRI signals at 15.2 T. Although our stimulation protocol did not induce any significant BOLD signals at the site adjacent to the light stimulus in wild-type naive mice (Supplementary Fig. 1), 20-Hz light stimulation elicited robust BOLD responses at the lateral geniculate nuclei (LGd and LGv; Fig. 4A, ROI), which are involved in the visual pathway, in both hemispheres (Fig. 4A, Control). These stimulation-induced artifacts were also observed with 20-Hz optogenetic stimulation. Group BOLD fMRI maps were obtained for 20-Hz optogenetic stimulation of VGAT-ChR2 (n = 5) and CaMKII-ChR2 mice (n = 5) and for forepaw stimulation (n = 5). In general, 20-Hz optogenetic stimulation of excitatory neurons induced a strong positive BOLD response at the stimulation site and ipsilateral downstream sites (Fig. 4A, Excitatory), whereas 20-Hz optogenetic stimulation of inhibitory neurons resulted in negative responses in the somatosensory network (Fig. 4A, Inhibitory). Electrical forepaw stimulation elicited positive BOLD responses in the somatosensory network (Fig. 4A, Forepaw), which is consistent with our previous mouse fMRI study (Jung et al. 2019). Optogenetic stimulation of excitatory neurons at 20 Hz elicited analogous activation sites, but they were higher and more extended than those seen with forepaw stimulation (Fig. 4A, Forepaw and Excitatory).
Figure 4 .

BOLD fMRI responses evoked by somatosensory and optogenetic stimulation. (A) ROIs defined based on the Allen Mouse Brain Atlas, and 15.2 T BOLD activation maps from the control opto-fMRI experiment, 20-Hz excitatory and inhibitory optogenetic stimulation, and forepaw stimulation are shown (n = 3 for control and 5 for each conditions). Activation maps were overlaid on the custom-made brain template. Scale bar: 2 mm. (B) Expanded maps in the subcortical area marked by red dashed boxes in (A). Scale bar: 0.5 mm. (C) Time courses extracted from three selected ROIs (top panel), and mean BOLD responses during the 5 s before and after the stimulus end time (bottom panel; indicated as red horizontal lines in the time course panel). Error bars: SEM (n = 5). Repeated measures ANOVA (*, P < 0.05; **, P < 0.01) with Bonferroni post-hoc analysis or paired t-test (++, P < 0.01) was performed. S1FL, primary somatosensory area, upper limb; S2, supplementary somatosensory area; MH, medial habenula; LH, lateral habenula; MD, mediodorsal nucleus of thalamus; DG, dentate gyrus; CL, central lateral nucleus of the thalamus; VM, ventral medial nucleus of the thalamus; LP, lateral posterior nucleus of the thalamus; PO, posterior complex of the thalamus; VPM, ventral posteromedial nucleus of the thalamus; VPL, ventral posterolateral nucleus of the thalamus; ZI, zona incerta; LGd, dorsal part of the lateral geniculate complex; LGv, ventral part of the lateral geniculate complex; RT, reticular nucleus of the thalamus.
To better visualize the activation sites of the BOLD responses, the thalamic region was expanded (Fig. 4B). Notably, stimulation of excitatory neurons evoked broad responses in the subcortical area, including the lateral and ventral groups of the thalamus and zona incerta, which have anatomical connections with the S1FL in rodents (Zakiewicz et al. 2014). A response in the ventral posterior complex was prominent with excitatory neural stimulation but was barely detected in other conditions; forepaw stimulation-induced activity in the medial and posterior groups of the thalamus, including PO.
Time courses were extracted from three anatomical ROIs that are commonly activated by forepaw and optogenetic stimulation: S1FL, S2, and PO (Fig. 4C). In general, in S1FL, a directly stimulated region, forepaw and CaMKII stimulation elicited positive BOLD responses in the ROIs (Fig. 4C, top panels). Meanwhile, VGAT stimulation elicited a distinct biphasic response. The initial positive response was more prominent at 1 Hz than at 20 Hz, and 1-Hz stimulation showed a delayed negative BOLD response, whereas the 20-Hz stimulation induced a negative BOLD peak around the time the stimulus ended. Since MUA showed a clear difference between superficial and deep layers, cortical depth-dependent BOLD responses to VGAT-ChR2 stimulation were also obtained (Supplementary Fig. 2). However, the BOLD responses did not exhibit any depth dependency, and thus, S1FL ROI data were used for further analyses. In S2 and PO, which are projection sites from S1FL, positive and negative responses were observed with forepaw/CaMKII-ChR2 and VGAT-ChR2 stimulation, respectively.
To quantitatively compare BOLD responses, the mean amplitude of the 10-s block centered at the stimulus end when the peak occurred in most cases was calculated (Fig. 4C, bottom panels). In S1FL, forepaw stimulation elicited a smaller response than CaMKII stimulation, and 20 Hz induced a greater response than 1 Hz (2.04 ± 0.30% for forepaw; 3.29 ± 0.30% for CaMKII 1 Hz; 4.60 ± 0.54% for CaMKII 20 Hz). In S2 and PO, the CaMKII 1 Hz and forepaw responses were comparable, and CaMKII 20 Hz had the greatest response (S2: 0.34 ± 0.17% for forepaw, 0.13 ± 0.07% for CaMKII 1 Hz, and 1.09 ± 0.40% for CaMKII 20 Hz; PO: 0.53 ± 0.31% for forepaw, 0.57 ± 0.10% for CaMKII 1 Hz, and 1.49 ± 0.48% for CaMKII 20 Hz). The VGAT responses in the projection sites decreased, and the 20 Hz response was larger than the 1 Hz response, albeit without statistical significance (S2: −0.56 ± 0.30% for VGAT 1 Hz and −0.97 ± 0.37% for VGAT 20 Hz; PO: −0.25 ± 0.26% for VGAT 1 Hz and −0.53 ± 0.22% for VGAT 20 Hz).
Investigation of a Distinctive Biphasic Response to VGAT Stimulation
Our BOLD fMRI on VGAT-ChR2 mice displayed a distinctive biphasic response that was not reported in previous optical imaging studies that stimulated VGAT-expressing neurons (Anenberg et al. 2015; Uhlirova et al. 2016; Vazquez et al. 2018; Krawchuk et al. 2020). To examine whether the difference between the BOLD and OIS data was due to different depth contributions or duration-dependency, CBV (530 nm)- and BOLD (625 nm)-weighted OISI was measured with two different stimulus durations, 5 and 20 s. Optogenetic stimulation of inhibitory neurons initially induced increases in CBV (negative reflectance) and BOLD (positive reflectance) at the stimulation site (5-s time in Fig. 5A,B). Then, the response to 1-Hz stimulation remained local, whereas the response to 20-Hz stimulation spread to almost entire the hemisphere with reversing polarity (darkening to whitening in CBV-weighted OIS and vice versa in BOLD-weighted OIS; Fig. 5A,B). Light artifact was observed at the optogenetic stimulation site (bright spots for 20-Hz stimulation), and its contribution was corrected in OIS time courses obtained from the c-shape ROI, based on control experiments (see Supplementary Fig. 3 for details).
Figure 5 .

CBV-weighted and BOLD-weighted OIS measurements with VGAT-ChR2 stimulation. (A and B) Time-dependent 530-nm CBV-weighted (A) and 625-nm BOLD-weighted OIS images (B) in response to 20-s optogenetic stimulation of VGAT-ChR2 in one representative animal (gray bar: ΔR/R). Location of the fiber optic and red c-shaped ROI overlaid on the baseline image are shown in the left panel, and the red time stamps indicate stimulation duration. A small bright spot in 20-Hz stimulation OISI is caused by the stimulus-induced light leakage artifact (see Supplementary Fig. 3). (C–E) Averaged time courses (n = 5) of HbT (C), HbO (D), and HbR (E) OISI induced by 20- and 5-s stimulation (inset). Blue shade, stimulation period.
CBV- and BOLD-weighted OIS time courses were converted into HbT, HbO, and HbR changes (Fig. 5C–E). In 20-s stimulation data, increases in HbT and HbO for 1-Hz stimulation were turned into biphasic responses (initial increase followed by decrease) for 20-Hz stimulation (Fig. 5C,D). The HbR response exhibited a decrease during the 20-s stimulation period followed by a poststimulus overshoot for 1-Hz stimulation, and an initial decrease right after the stimulus onset followed by an increase during the stimulation period for 20-Hz stimulation (Fig. 5E), which are consistent with BOLD fMRI, in the opposite polarity (Fig. 4C). In contrast, with 5-s stimulation, HbT, HbO, and HbR response exhibited a monotonic increase or decrease at both frequencies (Insets in Fig. 5C–E). For both stimulus durations, the 1-Hz response was larger, more positive, and lasted longer than the 20-Hz response. Our OIS data show that stimulus duration is a key determinant of the hemodynamic response shape, especially for 20-Hz optogenetic stimulation of VGAT-ChR2 mice.
The HRF of Excitatory and Inhibitory Neuronal Activity
To obtain insights into the BOLD and OIS responses, HRFs were modeled from the measured MUA response. When HRFs from the BOLD responses to forepaw and CaMKII stimulation were obtained from the 1-input/1-HRF model (Supplementary Fig. 4A), the excitatory HRFs showed similar amplitudes and patterns with variations of response width. However, when the 1-input/1-HRF model was used for VGAT-ChR2 mice, the HRF obtained from VGAT 1-Hz stimulation showed a negative phase (Fig. 6A, black line in Estimated HRF), indicating that a single MUA was insufficient to predict the BOLD responses. On the other hand, the 2-HRF model provided a better prediction of the original BOLD response. Although the inhibitory and excitatory MUA responses were larger with a 20-Hz stimulation, the predicted excitatory hemodynamic response was comparable for both frequencies, and the predicted inhibitory hemodynamic response was much smaller at 20 Hz. The excitatory HRF for 1-Hz VGAT-ChR2 stimulation had a similar shape, but it was ~2 times larger in magnitude than that with 20-Hz stimulation (Supplementary Fig. 4C). However, the inhibitory HRF from a 1-Hz VGAT-ChR2 stimulation has a biphasic shape and is ~20 times larger in magnitude than that of 20-Hz stimulation (Supplementary Fig. 4B). Besides, the time to peak of the inhibitory HRF precedes that of the excitatory HRF, which is highly important potentially for explaining BOLD fMRI responses. The predicted HRFs of HbR also displayed the same features as that of BOLD but with reversed polarity as expected (Fig. 6B).
Figure 6 .
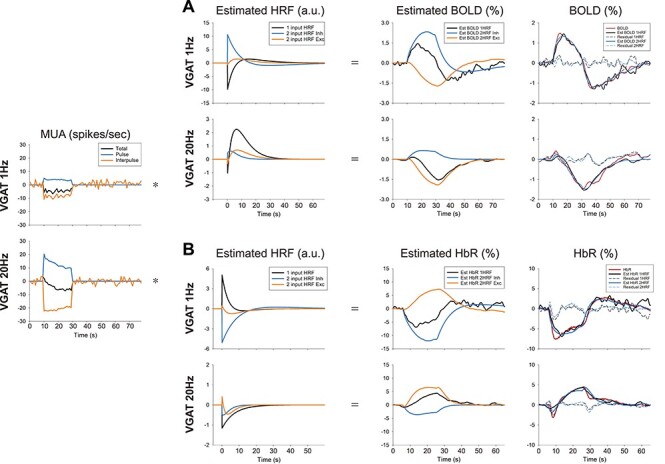
Estimation of the HRF by deconvolution of MUA from the BOLD and the HbR response. HRFs were generated in two ways: 1) one HRF (1 input HRF; black line) was generated from 1 MUA input (Total; black line), and 2) two HRFs (2 input HRF Inhibitory, light blue; 2 input HRF Excitatory, orange) were generated from 2 MUA inputs (Pulse and Interpulse). For 2 HRFs, the estimated BOLD (A) and HbR (B) responses are shown separately as the inhibitory component (Est BOLD/HbR 2HRF Inh; convolution of pulse MUA and 2 input HRF Inh), and excitatory component (Est BOLD/HbR 2HRF Exc; convolution of inter-pulse MUA and 2 input HRF Exc). In the rightmost panel, the estimated and measured BOLD responses are plotted together. Est BOLD/HbR 1HRF is the same as that in the third column; Est BOLD/HbR 2HRF is an addition of 2HRF Inh and Exc in the third column. The coefficient of determination R2: 0.9562 (1 Hz 1HRF), 0.9866 (1 Hz 2HRF), 0.8961 (20 Hz 1HRF), and 0.9269 (20 Hz 2HRF) for BOLD; 0.8157 (1 Hz 1HRF), 0.9345 (1 Hz 2HRF), 0.8659 (20 Hz 1HRF), and 0.846 (20 Hz 2HRF) for HbR.
Discussion
Using multimodal measurements with electrophysiology, BOLD fMRI, and OISI, we found several important issues associated with neurovascular coupling, especially when inhibitory neurons are selectively activated. First, activation of excitatory neurons via sensory and optogenetic stimulation induces positive BOLD responses with increased MUA, whereas activation of inhibitory neurons elicits a biphasic BOLD response at the stimulated site, with increased inhibitory and decreased excitatory activity. Second, the magnitude and polarity of hemodynamic responses at the stimulated site closely depend on the stimulation frequency and duration. Third, the response of deoxyhemoglobin content measured by OISI closely resembles that of BOLD fMRI. Fourth, hemodynamic responses to inhibitory neuronal activity can be explained by a combination of fast inhibitory HRF and slightly slower excitatory HRF. Overall, we provide insights into the neurovascular coupling properties of excitatory and inhibitory neurons.
Optogenetic fMRI of Excitatory or Inhibitory Neurons
Optogenetic fMRI (opto-fMRI) has opened a new window to examine cell-type-specific neural circuits and neurovascular coupling in the cortex and throughout the brain (Lee et al. 2010; Desai et al. 2011). However, most studies have been restricted to the BOLD responses initiated by excitatory neural stimulation, whereas opto-fMRI in response to stimulation of other neuronal types is somewhat limited. Initially, Desai et al. (2011) investigated the effects of anesthesia using opto-fMRI of CaMKII-ChR2 mice at 9.4 T and found that anesthesia with 0.7% isoflurane reduced BOLD activity by about 3 times compared with the awake condition (Fig. 4 in Desai et al.). Afterward, studies proceeded to the characteristics of the response: the BOLD response had temporal linearity to optogenetic stimulation in Thy1-ChR2 mice (Kahn et al. 2011); hemodynamic responses to excitatory neural stimulation correlated to spiking activity more strongly than to change in local field potential (LFP) (Ji et al. 2012; Kahn et al. 2013); and BOLD response functions in the rat somatosensory cortex were similar upon forepaw stimulation and optogenetic stimulation of excitatory cells (Iordanova et al. 2015). Measured BOLD fMRI was compared with calcium activity during optogenetic stimulation of excitatory neurons (Schmid et al. 2016), and the dynamics of fMRI responses were examined with optogenetic stimulation (Yu et al. 2016). Our BOLD fMRI studies of CaMKII-ChR2 mice showed extensive functional connections from the primary somatosensory cortex due to the increased sensitivity of the 15.2 T scanner (Fig. 4), which supports many previous studies of optogenetic fMRI obtained at 7.0–11.7 T in response to the stimulation of excitatory cells (Lee et al. 2010; Desai et al. 2011). Optogenetic fMRI scans were performed during the stimulation of inhibitory neurons in the GABAergic neuron-dominant striatum, and positive BOLD responses at the stimulated site were found (Bernal-Casas et al. 2017). However, to the best of our knowledge, there is no previous opto-fMRI report investigating the effect of inhibitory neurons on BOLD fMRI in the cortex, where excitatory neurons are dominant.
Characterization of the Neuronal Response Evoked by Activating GABAergic Neurons
To examine neurovascular coupling properties, it is necessary to measure neuronal activity. According to the previous literature, hemodynamic responses induced by sensory stimulation correlate better with the LFP than MUA (Logothetis et al. 2001), whereas those induced by optogenetic stimulation can be better explained by MUA than by LFP activity (Ji et al. 2012; Kahn et al. 2013). Therefore, we measured MUA with a depth electrode at the stimulated site (S1FL). Across the cortical depth, a rapid increase in MUA was followed by slow adaptation during a 20-s optogenetic stimulation of CaMKII-ChR2 mice, whereas sustained MUA was observed during forepaw stimulation (Fig. 3). Optogenetic stimulation of VGAT-expressing interneurons showed depth-dependent responses: an increase in MUA at the upper cortical layers close to the optogenetic stimulation light source and a decrease at the lower cortical layers (Fig. 3). This depth-dependent observation is consistent with responses to optogenetic stimulation of somatostatin (SOM)-expressing inhibitory neuron ChR2 mice (Lee, Boorman et al. 2020).
When VGAT-expressing interneurons are activated by optogenetic stimulation, cortical interneurons induce action potentials that prevent nearby cells from producing spontaneous activity, which was confirmed by current-clamp recording (Zhao et al. 2011) and single-unit recording (Guo et al. 2014; Li et al. 2019). To understand how inhibitory neurons affect hemodynamic responses, inhibitory and excitatory neuronal activity must be separated. When cortical depth-dependent MUA was separated into pulse and interpulse periods (Fig. 3C), increases in inhibitory activity and concomitant decreases in excitatory activity were consistently observed across the cortical depth, suggesting that our approach for separating excitatory and inhibitory activity is reasonable. We averaged neuronal activity across all channels to correlate it with the BOLD fMRI data because the tip of the fiber optic for optogenetic stimulation was located at a different depth (the surface of the cortex for electrophysiology vs. middle of the cortex for fMRI), and the BOLD response is considered not to have cortical laminar specificity as shown in our data (see Supplementary Fig. 2).
Hemodynamic responses of GABAergic neurons
The activity of GABAergic neurons is known to induce a hemodynamic response by releasing diverse vasoactive substances (Cauli et al. 2004; Cauli and Hamel 2010). Due to advances in optogenetics, the effect of inhibitory neurons on vascular responses has been examined in vivo using optical imaging and laser Doppler flowmetry. The initial studies attempted to modulate all sub-types of interneurons with optogenetic stimulation of VGAT-ChR2 (Anenberg et al. 2015; Uhlirova et al. 2016; Vazquez et al. 2018; Krawchuk et al. 2020); 100-Hz stimulation for 1 s induced an increase in CBF without causing glutamatergic synapsing (Anenberg et al. 2015); 5-Hz stimulation for 4 s similarly induced increases in CBF and CBV (Vazquez et al. 2018); and a single light pulse (150–400 ms duration) on VGAT-ChR2 induced a biphasic arterial vessel response: initial dilation with later constriction (Uhlirova et al. 2016). These positive CBV and CBF responses during short optogenetic stimulation of VGAT-ChR2 are consistent with our 5-s OIS data (Fig. 5). Note that our previous optogenetic stimulation of VGAT-ChR2 with 5 Hz under ketamine anesthesia (Vazquez et al. 2018) induces slightly prolonged CBV response compared with current 1-Hz stimulation data under ketamine/xylazine anesthesia, which is likely due to the use of α2-adrenergic agonist xylazine. When a 20-s train of 100-ms pulses at 1 Hz was applied to VGAT-ChR2, CBV increased quickly and reached a steady-state, and then, it decreased below the baseline after the stimulus ended (see Supplementary Fig. 4 in Desjardins et al. 2019), which is reasonably similar to our OIS and BOLD data in response to 1-Hz optogenetic stimulation.
An important observation in our studies is that deoxyhemoglobin OIS changes and BOLD fMRI responses to VGAT optogenetic stimulation remarkably resemble each other at both stimulation frequencies. Oxyhemoglobin and total hemoglobin response curves are also similar to that of deoxyhemoglobin responses with the opposite polarity (see Fig. 5). This suggests that hemodynamic findings with optical imaging tools are directly translatable to BOLD fMRI. When HRFs were determined from MUA and hemodynamic responses to VGAT optogenetic stimulation, inhibitory HRF peaks earlier than excitatory HRF for both frequencies. Inhibitory HRF of 1-Hz stimulation has a large positive component followed by a negative response, while that of 20-Hz stimulation has a much less positive response without a negative change. The large difference in inhibitory HRFs for 1- versus 20-Hz stimulation could be due to different contributions from different sub-types of GABAergic neurons, which could be altered by different stimulation frequencies.
According to brain slice studies (Cauli et al. 2004), nitric oxide (NO) and vasoactive intestinal polypeptide (VIP) neurons dilate microvessels, and neuropeptide Y (NPY) and SOM-expressing neurons constrict vessels. Recently, the effects of sub-types of interneurons on neurovascular regulation have been examined in vivo. More specifically, among the sub-types of GABAergic neurons, 1) NOS-expressing neurons are a key component responsible for vasodilation (Vazquez et al. 2018; Krawchuk et al. 2020), and 2) the activation of VIP-expressing neurons does not change blood flow (Krawchuk et al. 2020). On the other hand, 3) NPY has been shown to induce vasoconstriction (Uhlirova et al. 2016). 4) SOM-expressing neurons were reported to produce a biphasic hemodynamic response (Krawchuk et al. 2020; Lee, Boorman et al. 2020) that consisted of an initial CBF increase and poststimulus undershoot. Because SOM neurons also express a variety of molecular markers, including NOS and NPY (Perrenoud et al. 2012; Yavorska and Wehr 2016), the biphasic hemodynamic response can be explained by the possibility that early vasodilation by NOS is followed by late vasoconstriction by NPY. 5) Parvalbumin (PV) neurons, the most abundant GABAergic neurons in the cortex (Rudy et al. 2011), are assumed to have indirect influence through the inhibition of pyramidal cells, resulting in vasoconstriction (Urban et al. 2012; Lee, Stile, et al. 2021), although their exact contribution is complicated by the use of different anesthesia in different studies (Dahlqvist et al. 2020; Lee, Stile et al. 2021). Our observation of negative BOLD responses during 20-Hz optogenetic stimulation of VGAT-ChR2 is somewhat similar to that of deoxyhemoglobin changes to 20-Hz optogenetic stimulation of PV interneurons (Lee, Stile et al. 2021). To find out the exact cause of the frequency dependency, further studies with mouse models for specific interneuron sub-types are warranted.
The projection sites from S1FL showed negative BOLD responses when inhibitory neurons were active. Considering that most GABAergic neurons have local axonal projections, except for a few long-range projecting GABAergic neurons in the mouse brain (Tamamaki and Tomioka 2010), the reduction in the output spiking activity of excitatory neurons in S1FL reduces synaptic input to downstream sites, which can be considered deactivation (below the resting state). Our data in the projection sites support the notion that the negative BOLD response is caused by local suppression or deactivation (Shmuel et al. 2006). Overall, we conclude that the BOLD response caused by inhibitory neuronal activation is 1) biphasic by means of increased GABAergic and suppressed excitatory neurons and 2) negative by means of decreased synaptic input activity to the projection sites.
Limitations
Our studies have several limitations worth mentioning. First, ketamine/xylazine anesthesia was used for our studies. Ketamine is an NMDA (N-methyl-d-aspartate) antagonist, which can modulate neurovascular coupling. In previous functional studies under anesthesia versus wakefulness, ketamine reduces hemodynamic responses to optogenetic stimulation of PV neurons compared with wakefulness (Lee, Stile et al. 2021) but enhances cortical responses to sensory stimulation due to the disinhibition of pyramidal cells (Dinh et al. 2021). Second, due to relatively low sensitivity and limited temporal resolution of BOLD fMRI, we did not obtain fMRI data to 5-s stimulation. To compare OISI data with fMRI, it is necessary to obtain the corresponding fMRI with the same stimulation duration (2–5 s), which requires extensive signal averaging even at 15.2 T. Third, layer-dependent neurovascular coupling research is unique for fMRI investigations. However, we did not find depth-dependent variations of BOLD responses likely due to high BOLD responses in draining vessels. To compare depth-dependent neural activity and hemodynamic responses, laminar-specific CBF or CBV measurements (Poplawsky et al. 2015) are necessary. Fourth, the HRF obtained from BOLD responses to excitatory neuronal stimulation in CaMKII-ChR2 mice is much broader than that of forelimb stimulation. The measured MUA may be insufficient for proper modeling, since not-measured glial activity can also change hemodynamics. Alternatively, due to large neural activity in CaMKII-ChR2 mice, nonlinearities (with respect to the input) may be present which are not captured by the current HRF model. Fifth, in our HRF estimation, a 2-pole and 1-zero Laplace function was used for fitting overshoot and undershoot response features. Although a gamma-variate function is widely used for HRF estimation, the Laplace function captures the essence of hemodynamic response shape with fewer parameters. One important issue what we dealt with is an interaction between two HRF estimations. While the absolute timing of each depended on the initial guess of the optimization algorithm, the relative temporal features between two HRFs were well behaved. Thus, only general, not quantitative, observation of HRFs should be interpreted.
Conclusion
Stimulation of inhibitory neurons produced biphasic responses at the stimulation site, initial positive and later negative BOLD signals, and negative BOLD responses at downstream sites. The initial positive BOLD response is due to vasodilation induced by inhibitory neuronal activity, while the negative BOLD response is likely due to vasoconstriction by reduced excitatory activity. The HRF of inhibitory neurons peaks earlier than that of excitatory neurons, which may imply that the often-observed early BOLD fMRI overshoot is due to increased inhibitory neural activity.
Notes
We thank Ms Jungmi Lee for fiber implantation and virus injection, Prof. Kyoung-Nam Kim at Gachon University for providing a customized RF coil, Dr Geun Ho Im and Mr Chanhee Lee for maintaining the MR instruments and associated equipment, and Dr Konstantin Cherkas for constructing a home-built multi-wavelength optical imaging system.
Funding
Institute for Basic Science in Korea (IBS-R015-D1); National Institutes of Health (RO1-NS094404).
Supplementary Material
References
- Anenberg E, Chan AW, Xie Y, LeDue JM, Murphy TH. 2015. Optogenetic stimulation of GABA neurons can decrease local neuronal activity while increasing cortical blood flow. J Cereb Blood Flow Metab. 35(10):1579–1586. [DOI] [PMC free article] [PubMed] [Google Scholar]
- Avants BB, Tustison NJ, Song G, Cook PA, Klein A, Gee JC. 2011. A reproducible evaluation of ANTs similarity metric performance in brain image registration. Neuroimage. 54(3):2033–2044. [DOI] [PMC free article] [PubMed] [Google Scholar]
- Bauer AQ, Kraft AW, Baxter GA, Wright PW, Reisman MD, Bice AR, Park JJ, Bruchas MR, Snyder AZ, Lee JM, et al. 2018. Effective connectivity measured using optogenetically evoked hemodynamic signals exhibits topography distinct from resting state functional connectivity in the mouse. Cereb Cortex. 28(1):370–386. [DOI] [PMC free article] [PubMed] [Google Scholar]
- Bernal-Casas D, Lee HJ, Weitz AJ, Lee JH. 2017. Studying brain circuit function with dynamic causal modeling for optogenetic fMRI. Neuron. 93(3):522–532. [DOI] [PMC free article] [PubMed] [Google Scholar]
- Cauli B, Tong X-K, Rancillac A, Serluca N, Lambolez B, Rossier J, Hamel E. 2004. Cortical GABA interneurons in neurovascular coupling: relays for subcortical vasoactive pathways. J Neurosci. 24(41):8940–8949. [DOI] [PMC free article] [PubMed] [Google Scholar]
- Cauli B, Hamel E. 2010. Revisiting the role of neurons in neurovascular coupling. Front Neuroenergetics. 2:9. [DOI] [PMC free article] [PubMed] [Google Scholar]
- Cox RW. 1996. AFNI: software for analysis and visualization of functional magnetic resonance neuroimages. Comput Biomed Res. 29(3):162–173. [DOI] [PubMed] [Google Scholar]
- Dahlqvist MK, Thomsen KJ, Postnov DD, Lauritzen MJ. 2020. Modification of oxygen consumption and blood flow in mouse somatosensory cortex by cell-type-specific neuronal activity. J Cereb Blood Flow Metab. 40(10):2010–2025. [DOI] [PMC free article] [PubMed] [Google Scholar]
- Desai M, Kahn I, Knoblich U, Bernstein J, Atallah H, Yang A, Kopell N, Buckner RL, Graybiel AM, Moore CI. 2011. Mapping brain networks in awake mice using combined optical neural control and fMRI. J Neurophysiol. 105(3):1393–1405. [DOI] [PMC free article] [PubMed] [Google Scholar]
- Desjardins M, Kılıç K, Thunemann M, Mateo C, Holland D, Ferri CG, Cremonesi JA, Li B, Cheng Q, Weldy KLet al. 2019. Awake mouse imaging: from two-photon microscopy to blood oxygen level–dependent functional magnetic resonance imaging. Biol Psychiatry Cogn Neurosci Neuroimaging. 4(6):533–542. [DOI] [PMC free article] [PubMed] [Google Scholar]
- Dinh TNA, Jung WB, Shim H-J, Kim S-G. 2021. Characteristics of fMRI responses to visual stimulation in anesthetized vs. awake mice. Neuroimage. 226:117542. [DOI] [PubMed] [Google Scholar]
- Dunn AK, Devor A, Dale AM, Boas DA. 2005. Spatial extent of oxygen metabolism and hemodynamic changes during functional activation of the rat somatosensory cortex. Neuroimage. 27(2):279–290. [DOI] [PubMed] [Google Scholar]
- Guo ZV, Li N, Huber D, Ophir E, Gutnisky D, Ting JT, Feng G, Svoboda K. 2014. Flow of cortical activity underlying a tactile decision in mice. Neuron. 81(1):179–194. [DOI] [PMC free article] [PubMed] [Google Scholar]
- Iordanova B, Vazquez AL, Poplawsky AJ, Fukuda M, Kim S-G. 2015. Neural and hemodynamic responses to optogenetic and sensory stimulation in the rat somatosensory cortex. J Cereb Blood Flow Metab. 35(6):922–932. [DOI] [PMC free article] [PubMed] [Google Scholar]
- Ji LJ, Zhou JL, Zafar R, Kantorovich S, Jiang RX, Carney PR, Jiang HB. 2012. Cortical neurovascular coupling driven by stimulation of Channelrhodopsin-2. PLoS One. 7(9):e46607. [DOI] [PMC free article] [PubMed] [Google Scholar]
- Jung WB, Shim H-J, Kim S-G. 2019. Mouse BOLD fMRI at ultrahigh field detects somatosensory networks including thalamic nuclei. Neuroimage. 195:203–214. [DOI] [PubMed] [Google Scholar]
- Kahn I, Desai M, Knoblich U, Bernstein J, Henninger M, Graybiel AM, Boyden ES, Buckner RL, Moore CI. 2011. Characterization of the functional MRI response temporal linearity via optical control of neocortical pyramidal neurons. J Neurosci. 31(42):15086–15091. [DOI] [PMC free article] [PubMed] [Google Scholar]
- Kahn I, Knoblich U, Desai M, Bernstein J, Graybiel AM, Boyden ES, Buckner RL, Moore CI. 2013. Optogenetic drive of neocortical pyramidal neurons generates fMRI signals that are correlated with spiking activity. Brain Res. 1511:33–45. [DOI] [PMC free article] [PubMed] [Google Scholar]
- Kim S-G, Ogawa S. 2012. Biophysical and physiological origins of blood oxygenation level-dependent fMRI signals. J Cereb Blood Flow Metab. 32(7):1188–1206. [DOI] [PMC free article] [PubMed] [Google Scholar]
- Kocharyan A, Fernandes P, Tong X-K, Vaucher E, Hamel E. 2008. Specific subtypes of cortical GABA interneurons contribute to the neurovascular coupling response to basal forebrain stimulation. J Cereb Blood Flow Metab. 28(2):221–231. [DOI] [PubMed] [Google Scholar]
- Krawchuk MB, Ruff CF, Yang X, Ross SE, Vazquez AL. 2020. Optogenetic assessment of VIP, PV, SOM and NOS inhibitory neuron activity and cerebral blood flow regulation in mouse somato-sensory cortex. J Cereb Blood Flow Metab. 40(7):1427–1440. [DOI] [PMC free article] [PubMed] [Google Scholar]
- Lee J, Stile CL, Bice AR, Rosenthal ZP, Yan P, Snyder AZ, Lee J-M, Bauer AQ. 2021. Opposed hemodynamic responses following increased excitation and parvalbumin-based inhibition. J Cereb Blood Flow Metab. (In Press) doi: 10.1177/0271678X20930831. [DOI] [PMC free article] [PubMed] [Google Scholar]
- Lee JH, Durand R, Gradinaru V, Zhang F, Goshen I, Kim D-S, Fenno LE, Ramakrishnan C, Deisseroth K. 2010. Global and local fMRI signals driven by neurons defined optogenetically by type and wiring. Nature. 465(7299):788. [DOI] [PMC free article] [PubMed] [Google Scholar]
- Lee L, Boorman L, Glendenning E, Christmas C, Sharp P, Redgrave P, Shabir O, Bracci E, Berwick J, Howarth C. 2020. Key aspects of neurovascular control mediated by specific populations of inhibitory cortical interneurons. Cereb Cortex. 30(4):2452–2464. [DOI] [PMC free article] [PubMed] [Google Scholar]
- Li N, Chen S, Guo ZV, Chen H, Huo Y, Inagaki HK, Chen G, Davis C, Hansel D, Guo C, et al. 2019. Spatiotemporal constraints on optogenetic inactivation in cortical circuits. Elife. 8:e48622. [DOI] [PMC free article] [PubMed] [Google Scholar]
- Logothetis NK, Pauls J, Augath M, Trinath T, Oeltermann A. 2001. Neurophysiological investigation of the basis of the fMRI signal. Nature. 412(6843):150. [DOI] [PubMed] [Google Scholar]
- Logothetis NK. 2008. What we can do and what we cannot do with fMRI. Nature. 453(7197):869–878. [DOI] [PubMed] [Google Scholar]
- Mathiesen C, Caesar K, Akgören N, Lauritzen M. 1998. Modification of activity-dependent increases of cerebral blood flow by excitatory synaptic activity and spikes in rat cerebellar cortex. J Physiol. 512(2):555–566. [DOI] [PMC free article] [PubMed] [Google Scholar]
- Meyer HS, Schwarz D, Wimmer VC, Schmitt AC, Kerr JND, Sakmann B, Helmstaedter M. 2011. Inhibitory interneurons in a cortical column form hot zones of inhibition in layers 2 and 5A. Proc Natl Acad Sci USA. 108(40):16807–16812. [DOI] [PMC free article] [PubMed] [Google Scholar]
- Perrenoud Q, Geoffroy H, Gautier B, Rancillac A, Alfonsi F, Kessaris N, Rossier J, Vitalis T, Gallopin T. 2012. Characterization of type I and type II nNOS-expressing interneurons in the barrel cortex of mouse. Front Neural Circuits. 6:36. [DOI] [PMC free article] [PubMed] [Google Scholar]
- Poplawsky AJ, Fukuda M, Murphy M, Kim S-G. 2015. Layer-specific fMRI responses to excitatory and inhibitory neuronal activities in the olfactory bulb. J Neurosci. 35(46):15263–15275. [DOI] [PMC free article] [PubMed] [Google Scholar]
- Poplawsky AJ, Iordanova B, Vazquez A, Kim S-G, Fukuda M. 2021. Postsynaptic activity of inhibitory neurons evokes hemodynamic fMRI responses. Neuroimage. 225:117457. [DOI] [PMC free article] [PubMed] [Google Scholar]
- Rudy B, Fishell G, Lee S, Hjerling-Leffler J. 2011. Three groups of interneurons account for nearly 100% of neocortical GABAergic neurons. Dev Neurobiol. 71(1):45–61. [DOI] [PMC free article] [PubMed] [Google Scholar]
- Schmid F, Wachsmuth L, Schwalm M, Prouvot P-H, Jubal ER, Fois C, Pramanik G, Zimmer C, Faber C, Stroh A. 2016. Assessing sensory versus optogenetic network activation by combining (o) fMRI with optical Ca2+ recordings. J Cereb Blood Flow Metab. 36(11):1885–1900. [DOI] [PMC free article] [PubMed] [Google Scholar]
- Shim H-J, Jung WB, Schlegel F, Lee J, Kim S, Lee J, Kim S-G. 2018. Mouse fMRI under ketamine and xylazine anesthesia: robust contralateral somatosensory cortex activation in response to forepaw stimulation. Neuroimage. 177:30–44. [DOI] [PubMed] [Google Scholar]
- Shim HJ, Lee J, Kim SG. 2020. BOLD fMRI and hemodynamic responses to somatosensory stimulation in anesthetized mice: spontaneous breathing vs. mechanical ventilation. NMR Biomed. 33(7):e4311. [DOI] [PMC free article] [PubMed] [Google Scholar]
- Shmuel A, Augath M, Oeltermann A, Logothetis NK. 2006. Negative functional MRI response correlates with decreases in neuronal activity in monkey visual area V1. Nat Neurosci. 9(4):569. [DOI] [PubMed] [Google Scholar]
- Smith SM, Jenkinson M, Woolrich MW, Beckmann CF, Behrens TEJ, Johansen-Berg H, Bannister PR, De Luca M, Drobnjak I, Flitney DEet al. 2004. Advances in functional and structural MR image analysis and implementation as FSL. Neuroimage. 23:S208–S219. [DOI] [PubMed] [Google Scholar]
- Tamamaki N, Tomioka R. 2010. Long-range GABAergic connections distributed throughout the neocortex and their possible function. Front Neurosci. 4:202. [DOI] [PMC free article] [PubMed] [Google Scholar]
- Taniguchi H. 2014. Genetic dissection of GABAergic neural circuits in mouse neocortex. Front Cell Neurosci. 8:8. [DOI] [PMC free article] [PubMed] [Google Scholar]
- Uhlirova H, Kılıç K, Tian P, Thunemann M, Desjardins M, Saisan PA, Sakadžić S, Ness TV, Mateo C, Cheng Qet al. 2016. Cell type specificity of neurovascular coupling in cerebral cortex. Elife. 5:e14315. [DOI] [PMC free article] [PubMed] [Google Scholar]
- Urban A, Rancillac A, Martinez L, Rossier J. 2012. Deciphering the neuronal circuitry controlling local blood flow in the cerebral cortex with optogenics in PV::Cre transgenic mice. Front Pharmacol. 3:105. [DOI] [PMC free article] [PubMed] [Google Scholar]
- Vaucher E, Tong XK, Cholet N, Lantin S, Hamel E. 2000. GABA neurons provide a rich input to microvessels but not nitric oxide neurons in the rat cerebral cortex: a means for direct regulation of local cerebral blood flow. J Comp Neurol. 421(2):161–171. [PubMed] [Google Scholar]
- Vazquez AL, Fukuda M, Kim S-G. 2018. Inhibitory neuron activity contributions to hemodynamic responses and metabolic load examined using an inhibitory optogenetic mouse model. Cereb Cortex. 28(11):4105–4119. [DOI] [PMC free article] [PubMed] [Google Scholar]
- Watakabe A, Ohtsuka M, Kinoshita M, Takaji M, Isa K, Mizukami H, Ozawa K, Isa T, Yamamori T. 2015. Comparative analyses of adeno-associated viral vector serotypes 1, 2, 5, 8 and 9 in marmoset, mouse and macaque cerebral cortex. Neurosci Res. 93:144–157. [DOI] [PubMed] [Google Scholar]
- Yavorska I, Wehr M. 2016. Somatostatin-expressing inhibitory interneurons in cortical circuits. Front Neural Circuits. 10:76. [DOI] [PMC free article] [PubMed] [Google Scholar]
- Yu X, He Y, Wang MS, Merkle H, Dodd SJ, Silva AC, Koretsky AP. 2016. Sensory and optogenetically driven single-vessel fMRI. Nat Methods. 13(4):337–340. [DOI] [PMC free article] [PubMed] [Google Scholar]
- Zakiewicz IM, Bjaalie JG, Leergaard TB. 2014. Brain-wide map of efferent projections from rat barrel cortex. Front Neuroinform. 8:5. [DOI] [PMC free article] [PubMed] [Google Scholar]
- Zhao S, Ting JT, Atallah HE, Qiu L, Tan J, Gloss B, Augustine GJ, Deisseroth K, Luo M, Graybiel AM. 2011. Cell type–specific channelrhodopsin-2 transgenic mice for optogenetic dissection of neural circuitry function. Nat Methods. 8(9):745. [DOI] [PMC free article] [PubMed] [Google Scholar]
Associated Data
This section collects any data citations, data availability statements, or supplementary materials included in this article.