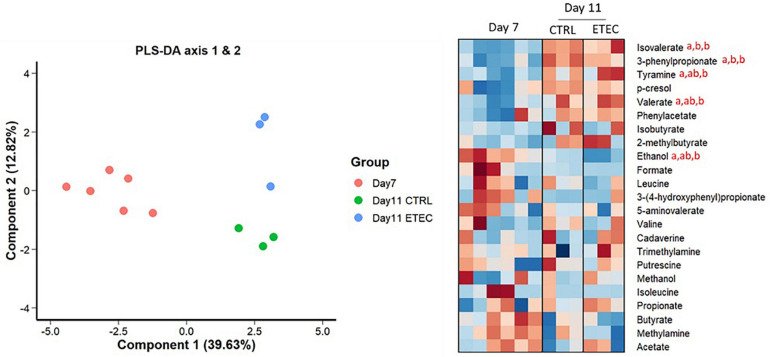
FIGURE 3.
NMR-based metabolomics analysis of mucin bead medium. Left panel: Individual plot of PLS-DA. Right panel: Heatmap representing the relative concentrations of all identified metabolites (rows) in individual samples (columns). The color represents the Z-scores (row-scaled relative concentration) from low (blue) to high values (red). The days sharing the same letters are not significantly different from each other (p > 0.05) whatever the conditions.

