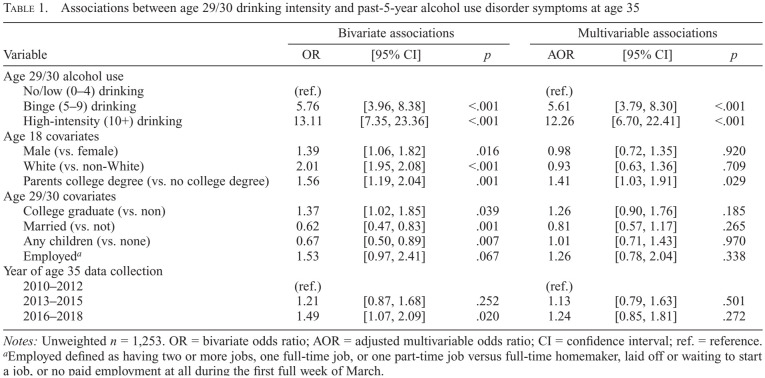
Table 1.
Associations between age 29/30 drinking intensity and past-5-year alcohol use disorder symptoms at age 35
| Variable | Bivariate associations | Multivariable associations | ||||
|---|---|---|---|---|---|---|
| OR | [95% CI] | p | AOR | [95% CI] | p | |
| Age 29/30 alcohol use | ||||||
| No/low (0–4) drinking | (ref.) | (ref.) | ||||
| Binge (5–9) drinking | 5.76 | [3.96, 8.38] | <.001 | 5.61 | [3.79, 8.30] | <.001 |
| High-intensity (10+) drinking | 13.11 | [7.35, 23.36] | <.001 | 12.26 | [6.70, 22.41] | <.001 |
| Age 18 covariates | ||||||
| Male (vs. female) | 1.39 | [1.06, 1.82] | .016 | 0.98 | [0.72, 1.35] | .920 |
| White (vs. non-White) | 2.01 | [1.95, 2.08] | <.001 | 0.93 | [0.63, 1.36] | .709 |
| Parents college degree (vs. no college degree) | 1.56 | [1.19, 2.04] | .001 | 1.41 | [1.03, 1.91] | .029 |
| Age 29/30 covariates | ||||||
| College graduate (vs. non) | 1.37 | [1.02, 1.85] | .039 | 1.26 | [0.90, 1.76] | .185 |
| Married (vs. not) | 0.62 | [0.47, 0.83] | .001 | 0.81 | [0.57, 1.17] | .265 |
| Any children (vs. none) | 0.67 | [0.50, 0.89] | .007 | 1.01 | [0.71, 1.43] | .970 |
| Employeda | 1.53 | [0.97, 2.41] | .067 | 1.26 | [0.78, 2.04] | .338 |
| Year of age 35 data collection | ||||||
| 2010–2012 | (ref.) | (ref.) | ||||
| 2013–2015 | 1.21 | [0.87, 1.68] | .252 | 1.13 | [0.79, 1.63] | .501 |
| 2016–2018 | 1.49 | [1.07, 2.09] | .020 | 1.24 | [0.85, 1.81] | .272 |
Notes: Unweighted n = 1,253. OR = bivariate odds ratio; AOR = adjusted multivariable odds ratio; CI = confidence interval; ref. = reference.
Employed defined as having two or more jobs, one full-time job, or one part-time job versus full-time homemaker, laid off or waiting to start a job, or no paid employment at all during the first full week of March.

