
Figure 3.
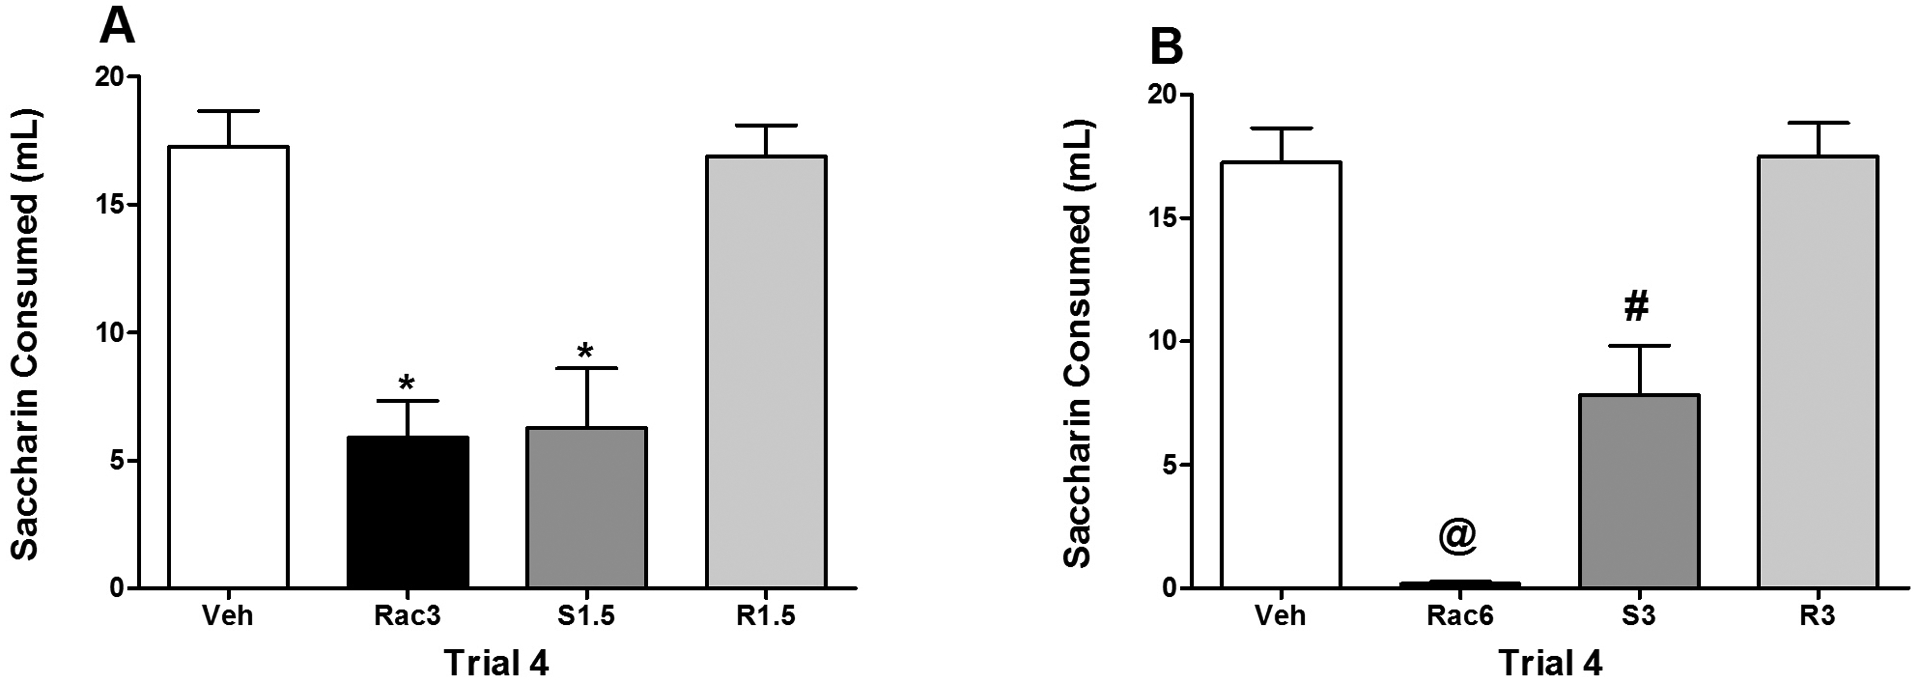
Mean (+/− SEM) saccharin consumption (ml) on Trial 4 for Groups Veh, Rac3, S1.5 and R1.5 (Panel A) and Groups Veh, Rac6, S3 and R3 (Panel B). Panel A: *significantly different from Groups Veh and R1.5. Panel B: @significantly different from all other groups. #significantly different from Groups Veh and R3.