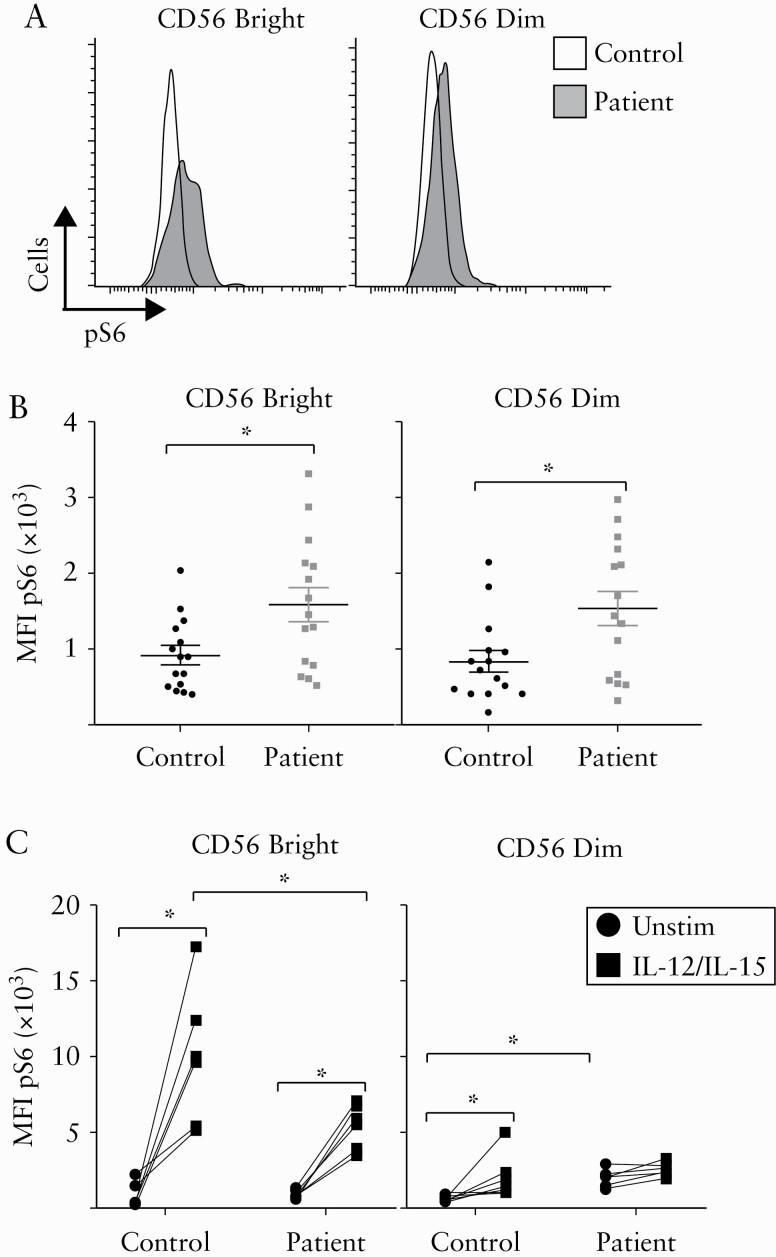
Figure 2.
Impaired mTORC1 activity in NK cells from IBD patients. Freshly isolated PBMCs were analysed for pS6 levels by intracellular flow cytometry staining. [A,B] Representative histogram [A] and collective data [B] are shown for NK cells stratified into CD56bright and CD56dim cells [n = 15]. [C] PBMCs were stimulated for 18 h with IL-12 plus IL-15 or left unstimulated. Cells were then analyzed for pS6 levels by intracellular flow cytometry staining. NK cells were stratified into CD56bright [right panel] and CD56dim cells [left panel]. Bars show the average value ± SEM. Samples were compared using a Student t test or two-way ANOVA as appropriate. *p < 0.05, **p < 0.01, ***p < 0.001.

