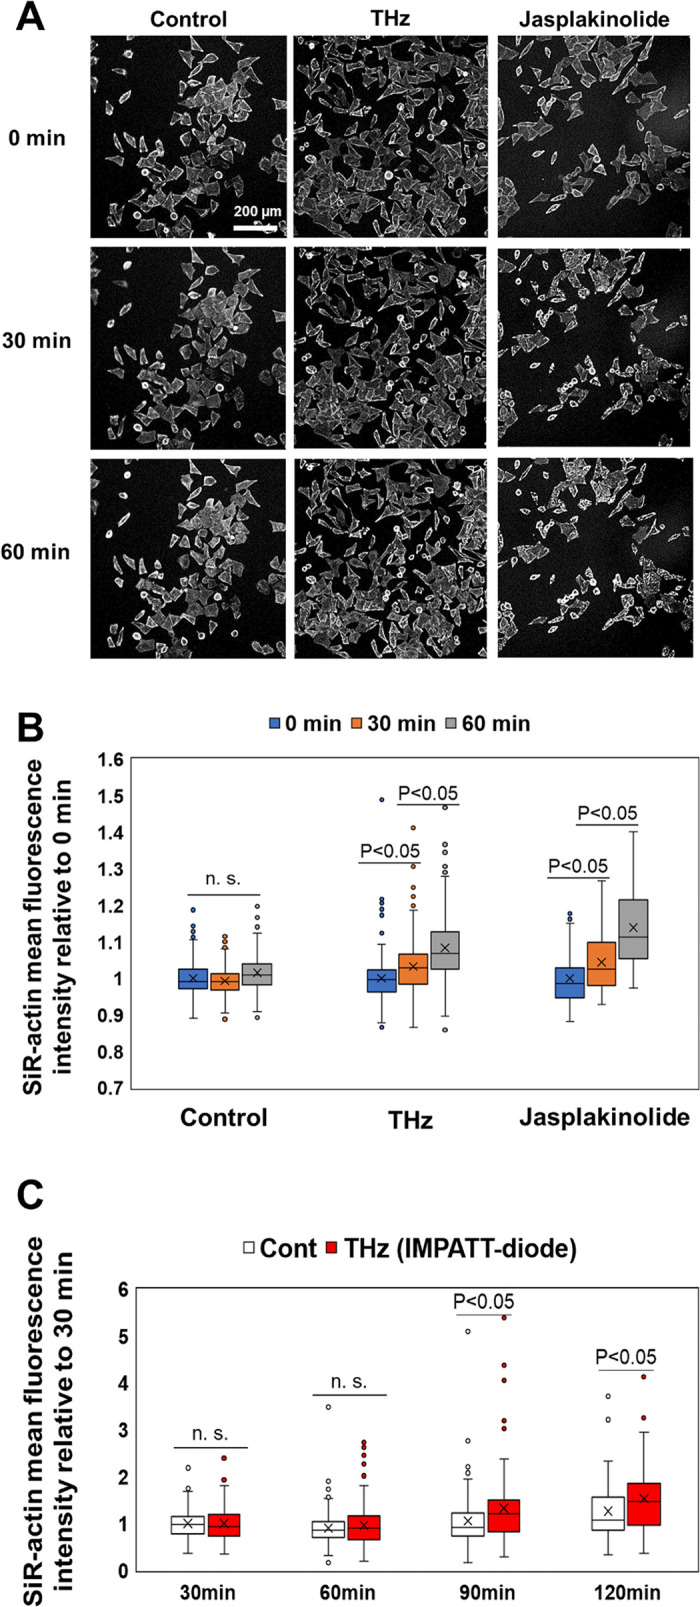
Fig 4. THz waves enhance actin polymerization in cells.

(A) Fluorescence microscopy images of cells stained with SiR-actin at 0, 30, and 60 minutes. THz irradiation was started at 0 minutes and continued for 60 minutes. As a positive control, cells were treated with 10 nM jasplakinolide at 0 minutes to induce actin polymerization. The white bar shows a scale of 200 μm. (B) Mean fluorescence intensity of SiR-actin in individual cells measured from the fluorescence microscopy images. The box plot shows the mean value relative to 0 minutes. The standard deviations of three independent experiments are shown. More than 77 cells were measured in each experiment. (C) Irradiation with THz waves generated by the IMPATT-diode source was started at 0 minutes and continued for 120 minutes. The mean fluorescence intensity of SiR-actin in individual cells was measured from the fluorescence microscopy images. The box plot shows the mean value relative to that measured at 30 minutes. The standard deviations of three independent experiments are shown. More than 120 cells were measured in each experiment.
