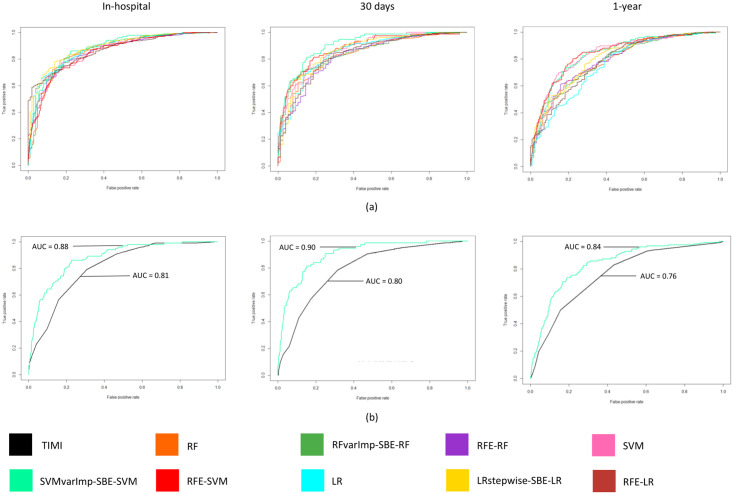
Fig 1. The receiver operating characteristics (ROC) curves of ML models and TIMI score based on a 30% validation dataset.
ROC curves show the performance for In-hospital, 30 days and 1-year ML mortality prediction models (a). The ROC values for TIMI against the best ML model (SVMvarImp-SBS-SVM). Abbreviations: varImp = variable importance.

