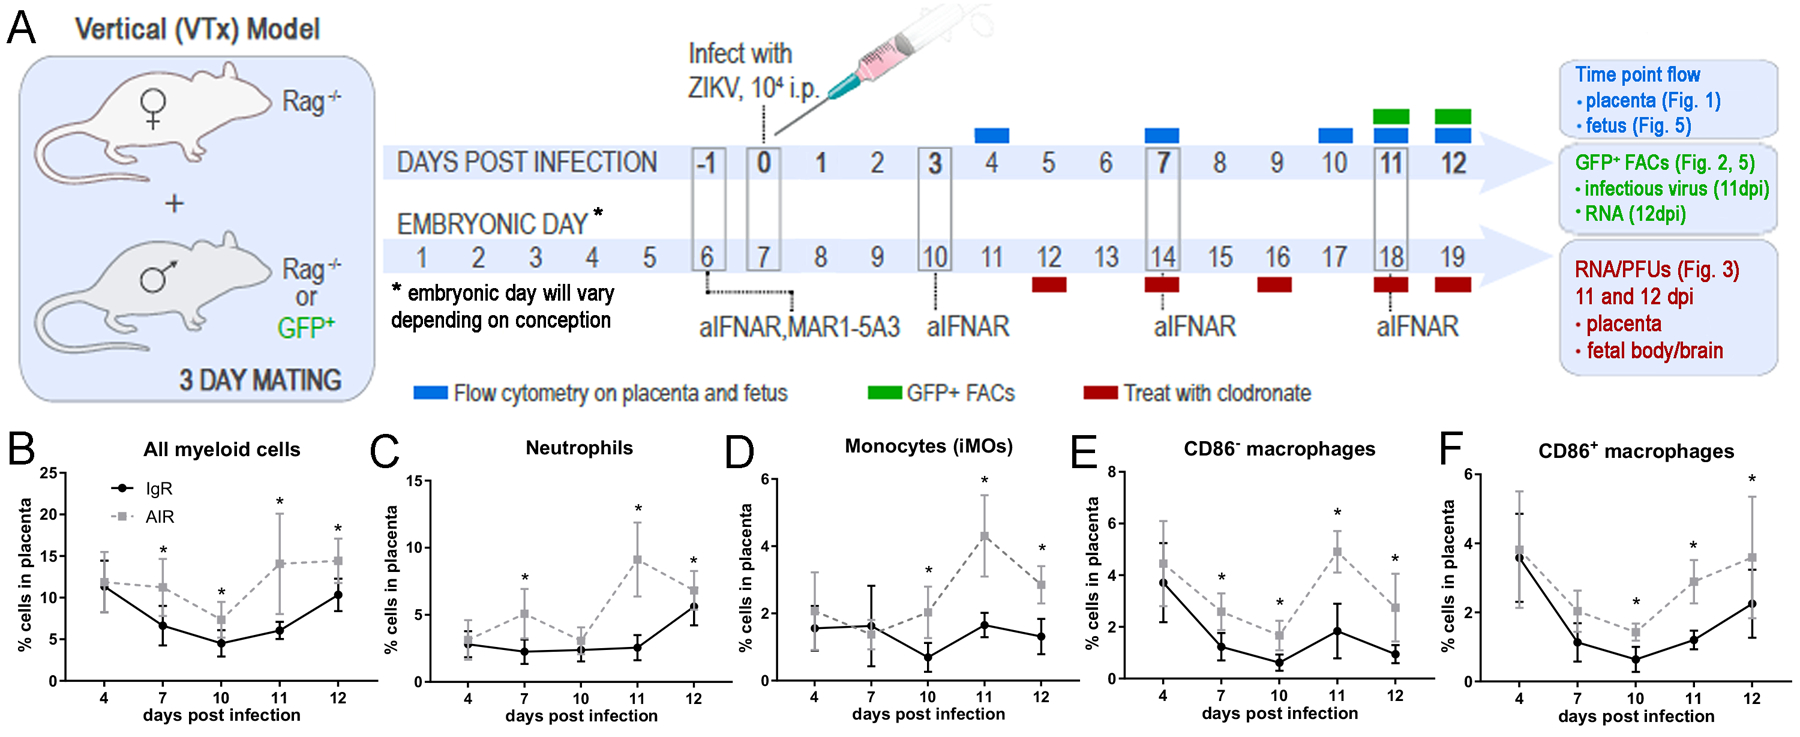
Fig. 1. Myeloid cell infiltration into placenta in ZIKV infected IgR and AIR mice.

(A) Timeline schematic of experimental manipulations for the generation of ZIKV infected, pregnant AIR mice and tissue time point collections. Flow cytometry phenotyping experiments time points are shown in blue. FACs sorting experiment time points for infectious center assays and RNA experiments are shown in green. The injection schedule for myeloid cell depletions are shown in red and the dpi and what tissues were taken. (B-F) Placental tissue was collected from IgR and AIR litters at the indicated timepoints and analyzed via flow cytometry for markers of myeloid cell populations. Plots of all myeloid cells (B), neutrophils (C), monocytes (iMOs) (D), CD86− macrophages (E) and CD86+ macrophages (N) populations as a percent of the all placenta cells from IgR (black symbols) and AIR (gray symbols) placentas are shown for each time point during infection. Each dot represents a total of 11–36 placentas for two to four litters from infected IgR or AIR dams (animal number breakdown in materials and methods). Statistical significance was determined using a two-way ANOVA with a Sidak’s multiple comparisons test. *=p<0.05, **=p<0.01. Error bars represent standard deviation.
