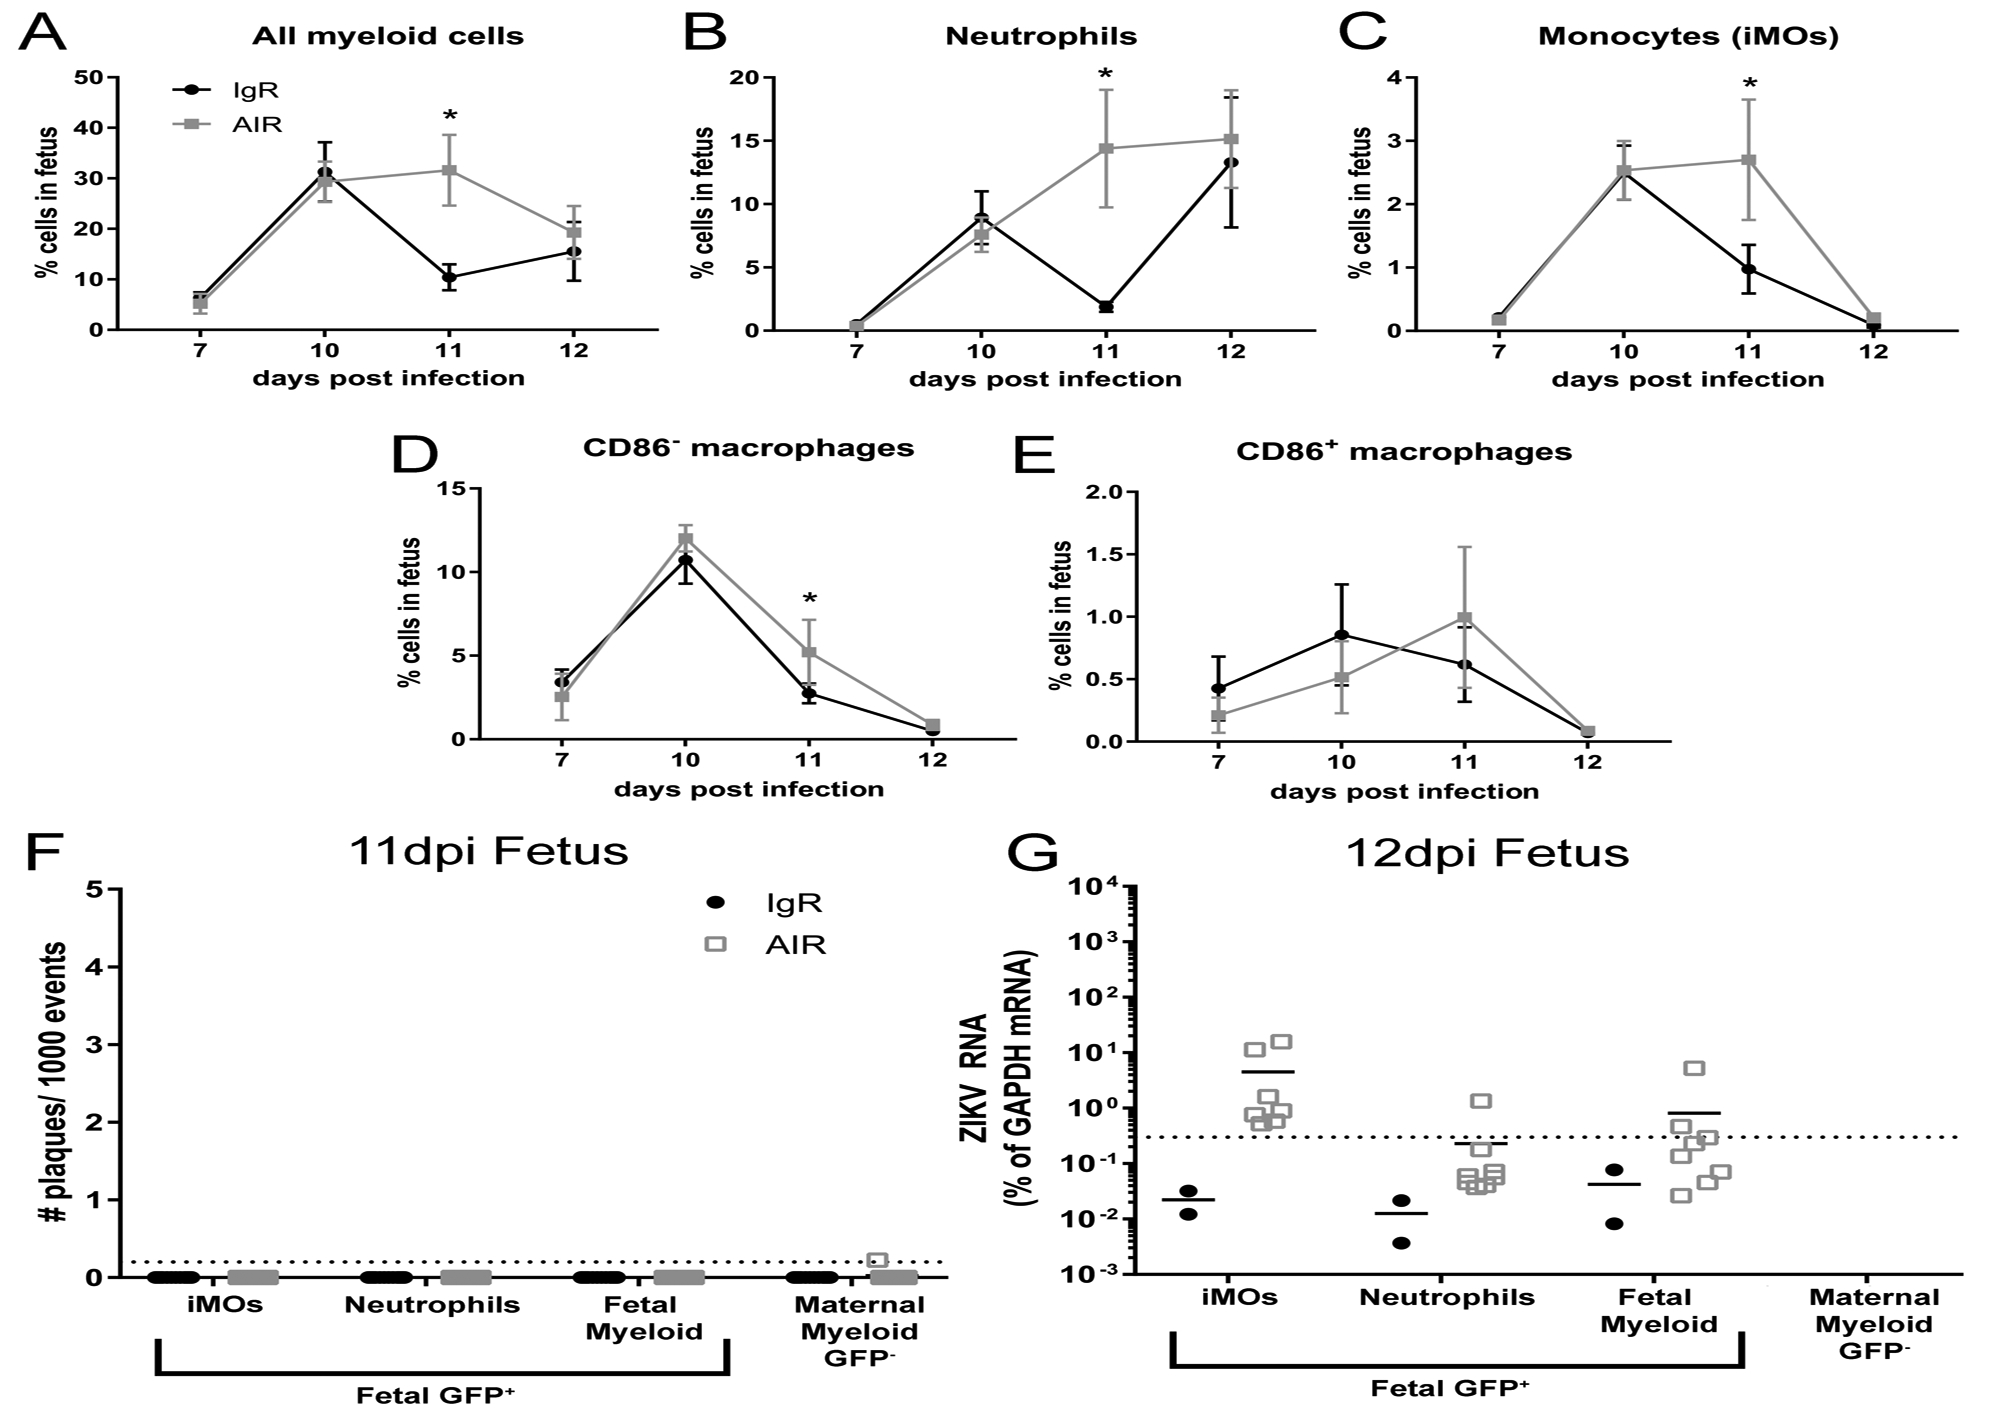
Fig. 5. Myeloid cells in the fetus are insufficient to protect against ZIKV infection.

From some of the same litters at the 7–12dpi time points shown in Fig. 1, myeloid cells populations isolated from the whole fetus were analyzed using the same flow cytometry gating strategy (Sup. Fig. 1). Plots of all fetal myeloid cells (A), neutrophils (B) and monocytes (iMOs, C), CD86− macrophages (D) and CD86+ macrophages (E) are shown as a percent of that cell population within the whole fetus. A two-way ANOVA with a Sidak’s multiple comparisons test was performed to determine statistical significance. *=p<0.05. Error bars represent standard deviation. From the same 11 and 12dpi IgR or AIR GFP+ heterozygous litters shown in Fig. 2, Percoll enrich myeloid cells were isolated and sorted from the whole fetus and analyzed for infectious centers (F) or ZIKV RNA (E) expression using the same strategy. At 12dpi, too few maternal myeloid cells were obtained from either treatment group for RNA analysis to be performed.
