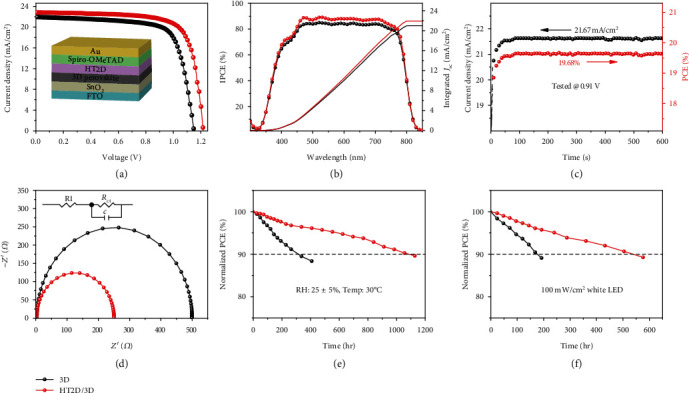
Figure 4.

Device performance for 3D or HT2D/3D-based PSCs: (a) conventional n-i-p PSC architecture used in this work and J − V curves of the champion PSCs measured under 1 sun AM 1.5G with a scan rate of 10 mV s−1 using a 0.1 cm2 mask; (b) IPCE and the corresponding integrated Jsc for the best performing PSCs; (c) the stable output of a champion HT2D/3D-based device at a maximum power point of 0.91 V; (d) Nyquist plot of PSCs at a potential bias of 0.5 V and frequency range from 1 to 105 Hz, in the dark; (e) stability test of PSCs stored in ambient air with a relative humidity of 25 ± 5% at 30°C; (f) the photostability of PSCs under illumination of 100 mW/cm2 white LED light in N2 glove box.
