
FIGURE 4.
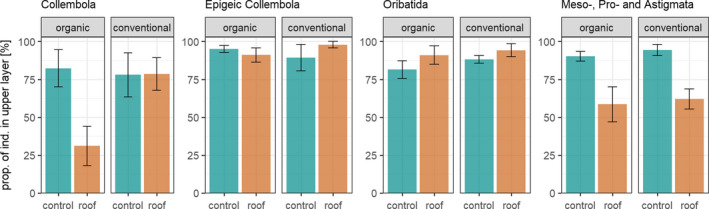
Depth distribution of Collembola, epigeic Collembola, and Oribatida and Meso‐, Pro‐, and Astigmata in control and drought treatments (roof) under organic and conventional management as proportion of individuals (of total) in the upper layer (0–5 cm); means ± SE based on four replicates