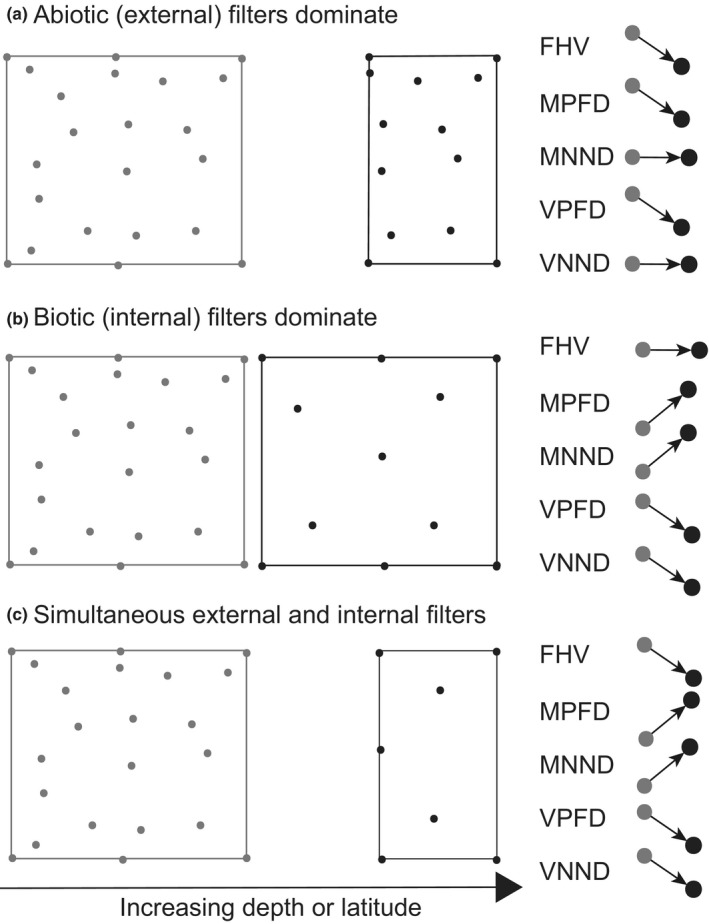
FIGURE 1.

Schematic diagram of three conceptual models of changes in functional space (and functional diversity metrics) when moving from a relatively benign (gray), to a more extreme environment (black). Points represent species (or individuals), and the squares represent the bounds of functional space. (a) Abiotic filters cause a decrease in functional volume, but species packing remains unchanged. (b) Biotic filters, such as increased competition for limited resources, do not affect volume, but decrease the packing of species (or individuals) in functional space. (c) Harsh abiotic conditions, decreased resources, and increased competition combine to yield a decrease in volume and also in the packing of species. FHV, functional hypervolume; MPFD, mean pairwise functional distance; MNND, mean nearest neighbor distance; VPFD, variance in pairwise functional distance; VNND, variance in nearest neighbor distance
