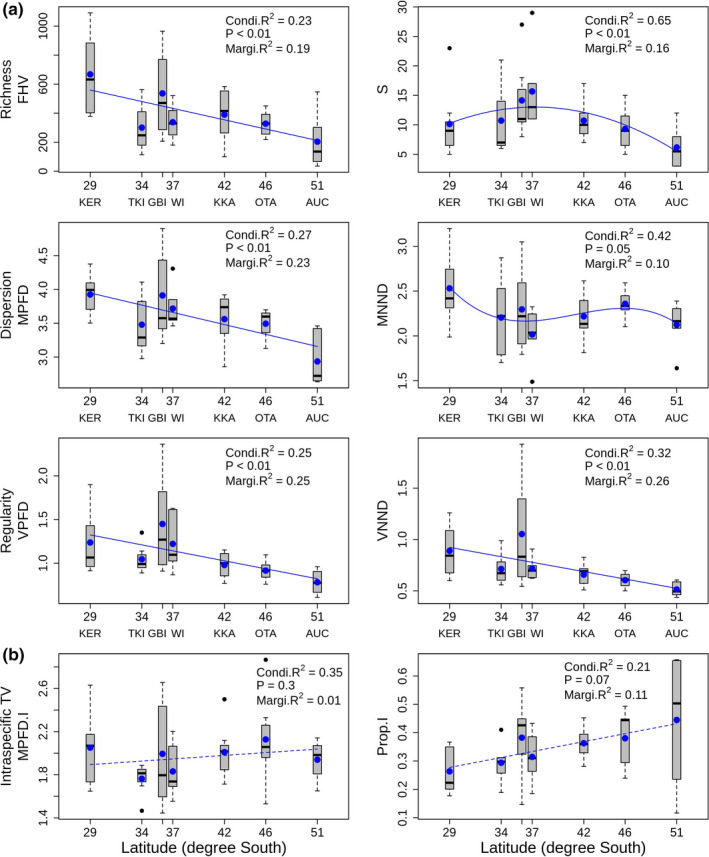
FIGURE 3.

Relationships between functional diversity metrics (means ± 1SE across 7 depth strata) and latitude in degrees south (KER = Rangitāhua, Kermadec Islands, TKI = Three Kings Islands, GBI = Great Barrier Island, WI = Whakaari, White Island, KKA = Kaikōura, OTA = Otago, and AUC = Auckland Islands): (a) species‐level metrics; (S = species richness) and (b) intraspecific trait variability metrics. Lines show fitted values for the best model for each metric when latitude was considered a fixed factor, and depth a random factor (see Table S2 in Supplementary Material). Solid lines show statistically significant trends (p < .05); dashed lines show trends that did not reach statistical significance at the 0.05‐level. The conditional R 2 (Condi.R 2) and marginal R 2 (Margi.R 2) are overlaid for each metric and represent variation explained by both fixed and random effects jointly and variation explained only by the fixed effects, respectively (Nakagawa et al., 2017). Blue dots represent the average value per latitude. Black horizontal bars, black dots, and boxes show the median, outliers, and interquartile range, respectively. Whiskers represent 1.5 times the interquartile range
