
FIGURE 4.
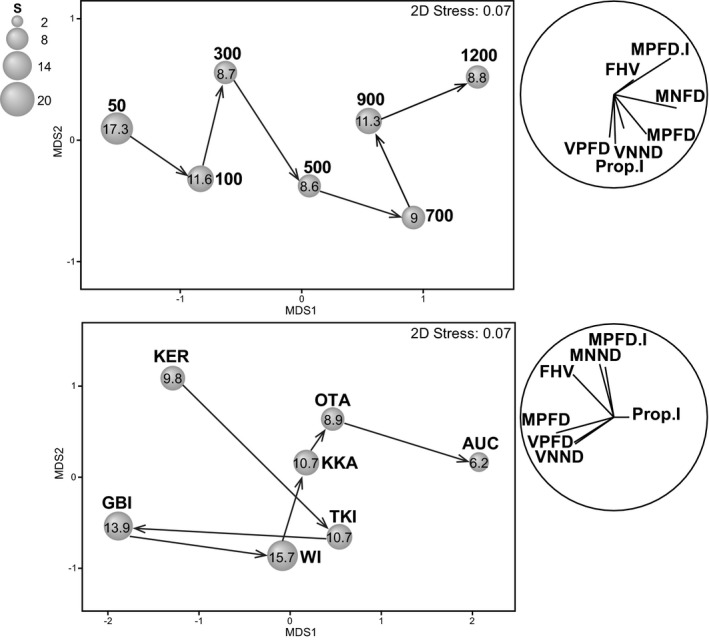
Metric multidimensional scaling (mMDS) ordination of normalized functional diversity metrics on the basis of Euclidean distances among (a) depth centroids (50 m to 1,200 m) and (b) location centroids. Overlaid arrows follow a shallow to deep, and north to south trajectory, respectively. Bubble sizes are proportional to mean species richness (also provided as a value inside each bubble). Vectors (right) show multiple partial correlations for each of p = 7 functional metrics with the mMDS axes