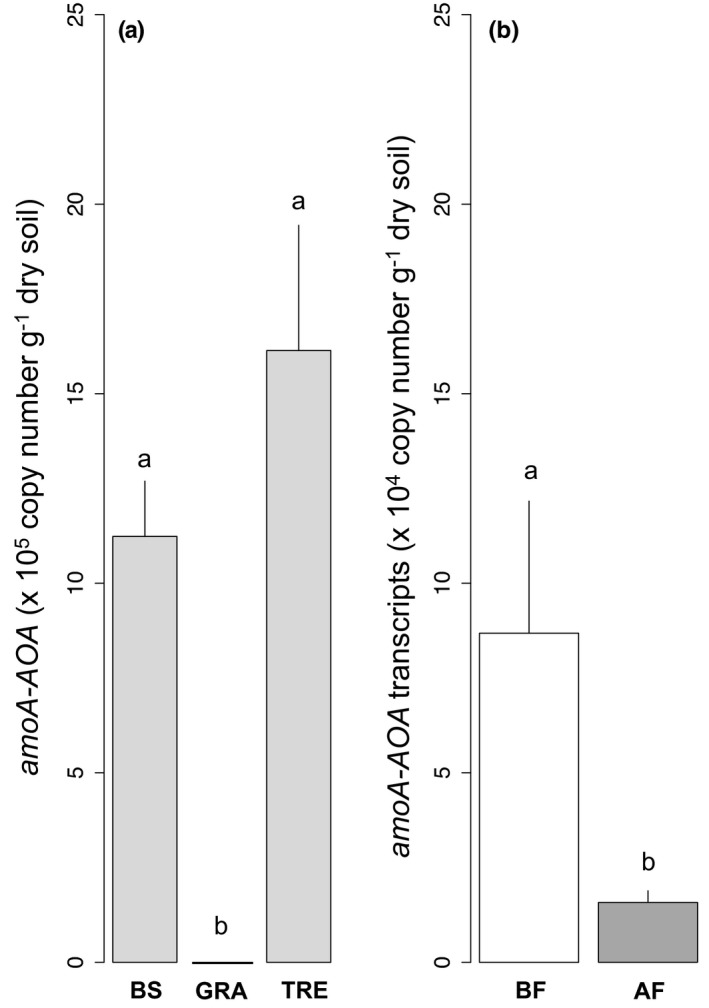
FIGURE 3.

Abundances (a) and transcripts (b) of archaeal‐AOA amoA genes according to the vegetation cover and the fire treatment: bare soil (BS), dominant grass species Hyparrhenia diplandra (GRA) and dominant tree species Crossopteryx febrifuga (TRE), before fire (BF, in white) and after fire (AF, in gray), light gray = mean effect of the vegetation cover. Means and SEs were calculated from ten replicates for the vegetation cover effect and fifteen replicates for the fire effect, and small letters indicate statistical difference (p < 0.05)
