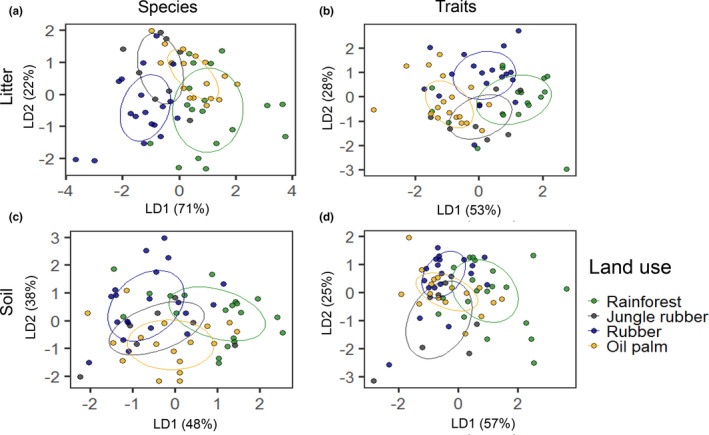
FIGURE 4.

Linear discriminant analysis (LDA) of species (a, c) and trait composition (b, d) of Collembola communities in litter (a, b) and soil (c, d); data pooled for sampling years (2013 and 2016). Land‐use system was used as grouping variable. Ellipses were calculated using the MASS package in R to visualize the grouping of species or traits in the different land‐use systems. Each point represents a sample
