FIGURE A3.

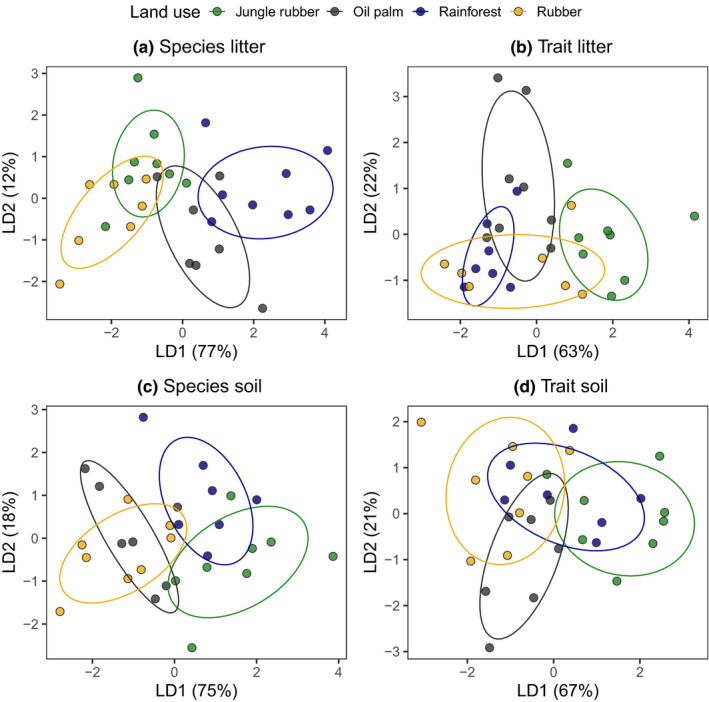
Linear discriminant analysis of species (a, c) and trait composition (b, d) of Collembola communities in the litter (a, b) and soil layer (c, d) in 2013. Land‐use system was used as grouping variable. Each point represents a sample

Linear discriminant analysis of species (a, c) and trait composition (b, d) of Collembola communities in the litter (a, b) and soil layer (c, d) in 2013. Land‐use system was used as grouping variable. Each point represents a sample