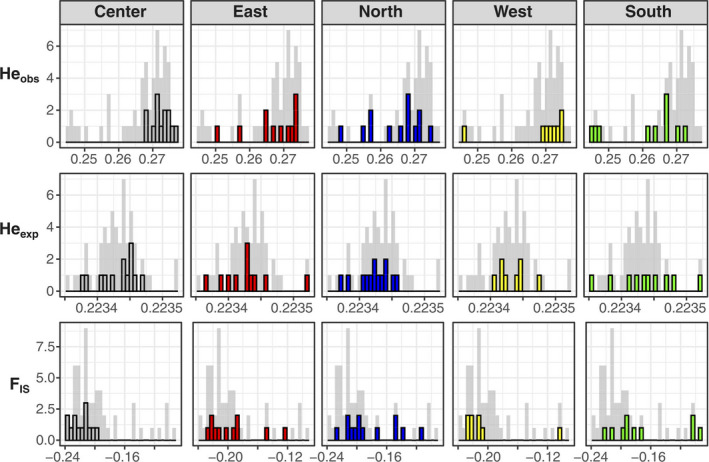
FIGURE 5.

Frequencies of observed values in the three genetic diversity metrics observed heterozygosity (Heobs), expected heterozygosity (Heexp), and inbreeding coefficient (F IS) at the individual level. Gray bars represent all 55 individuals, and the highlighted and colored bars represent the frequencies in each sampling area by column. Center area highest values for Heobs and lowest for F IS while in the other sampling areas the values are more distributed
