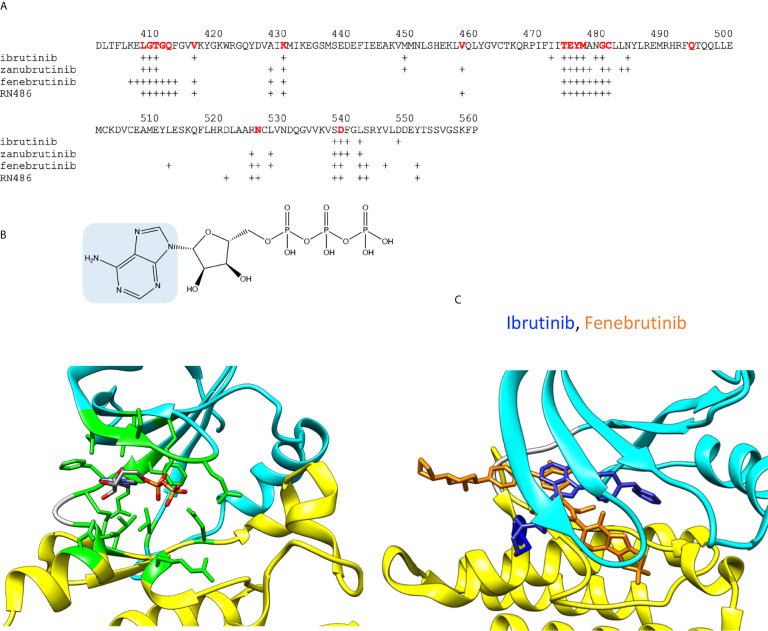
Figure 2.
ADP and inhibitor binding. (A) BTK sequence indicating amino acids within 5 Å radii from ADP or inhibitors. For ATP binding, residues corresponding to interacting amino acids in BTK are shown in red. Crosses indicate the interacting amino acids in inhibitor complexes. (B) Upper panel: Chemical structure of ATP, adenine is highlighted in blue. Lower panel: ADP bound to ITK kinase domain (4m15). Residues within 5 Å from ADP are in green. Atoms in the ADP are colored based on the elements, carbon gray, nitrogen blue, oxygen red, and phosphorus orange. (C) Differences in the binding modes of the covalent inhibitor, ibrutinib (blue, 5p9j), and non-covalent inhibitor, fenebrutinib (orange, 5vfi), to BTK. C481 is in blue.

