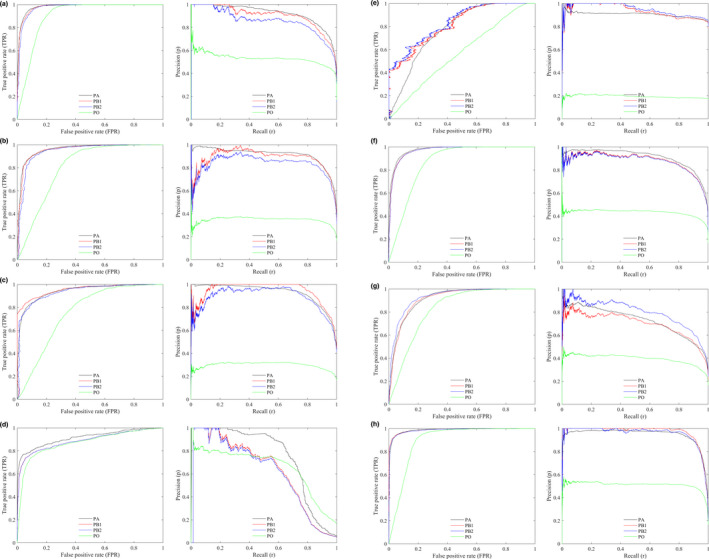
FIGURE 2.

The ROC (left) and PR (right) curves by PA, PB, and PO approaches. PB1: prevalence is given; PB2: prevalence is estimated. Model: ANN trained with a sample size of 1,000. Virtual species: spec1 (a); spec2 (b); spec3 (c); spec4 (d); spec5 (e). Aerial photograph: urban (f); tree (g); grass (h)
