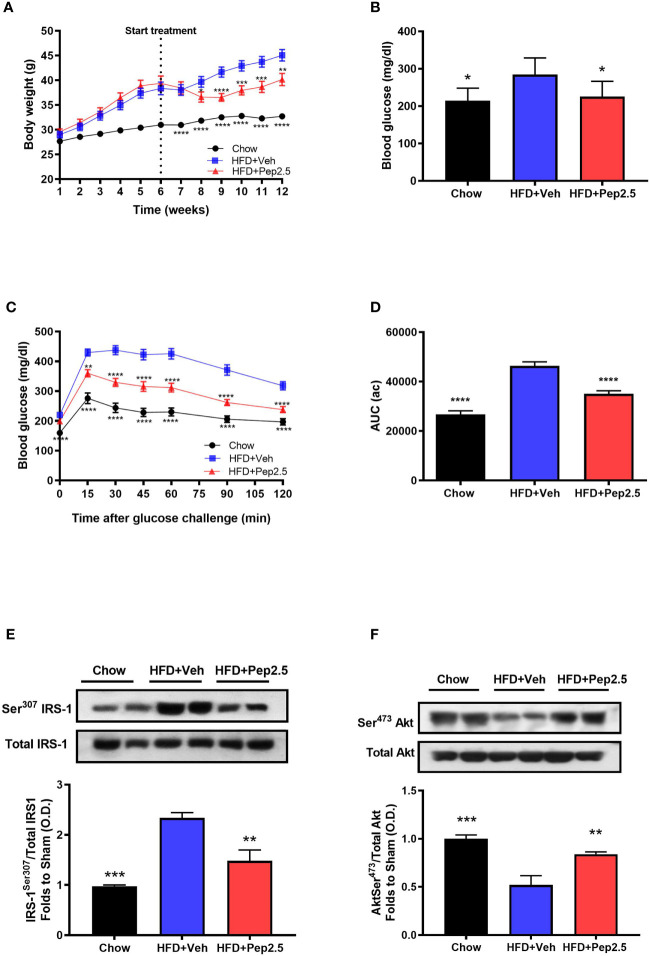
Figure 2.
Peptide 19-2.5 ameliorated glycemic regulations by the improvement of insulin signaling in HFD-fed mice. (A) Body weight was measured once a week for 12 weeks (g). (B) Non-fasting glucose levels were measured at week 12 (mg/dl) (C) Oral glucose tolerance (OGTT) was assessed over 120 min, after receiving an oral dose of glucose at week 12 (mg/dl) and the (D) area under the curve (AUC) of OGTT was calculated for respective groups and used for statistical analysis (au). Data are expressed as mean ± SEM; n = 20 per group, n = 10 for non-fasting glucose levels. *P < 0.05, **P < 0.01, ***P < 0.001, and ****P < 0.0001 vs. HFD + Veh. (E) Densitometric analysis of the bands is expressed as relative optical density (O.D.) for the phosphorylation on Ser307 IRS-1in the liver and normalized to total IRS-1 and (F) for the phosphorylation on Ser473 of Akt in the liver normalized to total Akt. Data was analyzed by one-way ANOVA, with Bonferroni post-hoc test. Data are expressed as mean ± SEM; chow (n = 5), HFD+Veh (n = 6), HFD+Pep2.5 (n = 6). **P < 0.01 and ***P < 0.001 vs. HFD+Veh.

