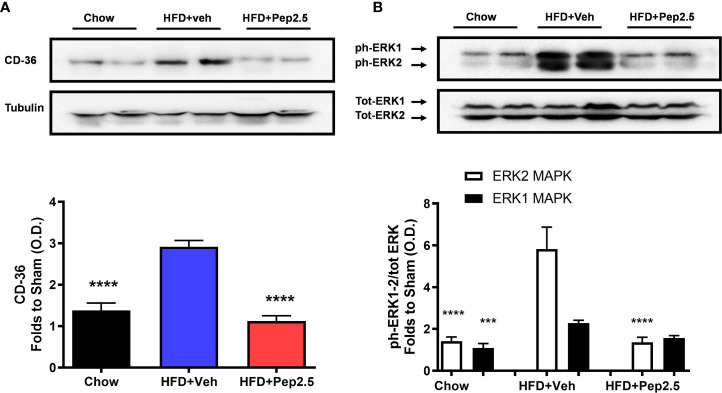
Figure 7.
Peptide 19-2.5 reduces CD36 expression and the activation of ERK in the liver of HFD-fed mice. Liver samples were collected at the end of the experiment and the expression of CD36 and the phosphorylation of ERK1/2 were assessed. Densitometry analysis of the bands is expressed as relative optical density (O.D.) of (A) CD36 expression, corrected against tubulin and normalized using the related chow bands; (B) phosphorylation of ERK1/2 corrected to the corresponding total ERK1/2 content and normalized using the related chow band. Data was analyzed by one-way ANOVA, with Bonferroni post-hoc test. Data are expressed as mean ± SEM; n = 8 per group. ***P < 0.001 and ****P < 0.0001 vs. HFD+Veh

