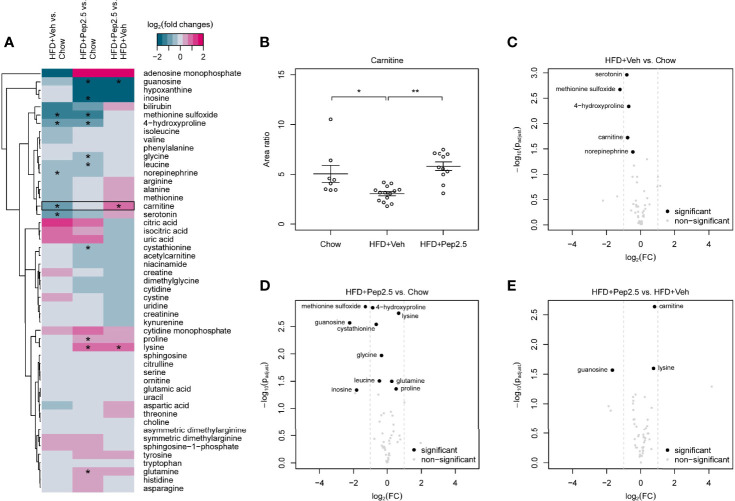
Figure 9.
Effect of peptide 19-2.5 administration on primary metabolites in the serum of HFD-fed mice at week 12. HFD-fed mice received either vehicle or peptide 19-2.5. Metabolome analysis was performed on serum samples. Chow (n = 8), HFD+Veh (n = 13), HFD+Pep2.5 (n = 11). (A) Heatmap of all detected primary metabolites. Log2 fold changes and P-values*< 0.05 are shown for all tested groupwise comparisons: HFD+Veh vs. chow, HFD+Pep2.5 vs. chow and HFD+Pep2.5 vs. HFD+Veh. Each column represents a groupwise comparison and each row defines an analyte. Analytes were hierarchically clustered using Ward’s minimum variance method (26) and an euclidian distance between log2 fold changes. Dendrograms provide information about distances between clusters. Black frames show analytes with significant differences between the chow and HFD+Veh group as well as that between the HFD+Veh and HFD+Pep2.5 group. (B) Dot plot of carnitine shows restored levels in HFD-fed mice treated with peptide 19-2.5. Area ratios were calculated by dividing peak area of carnitine by peak area of the related internal standard. Data expressed as mean ± SEM for n number of observations. *P < 0.05 and **P < 0.01 vs. HFD+Veh. (C–E) Volcano plots of primary metabolites. Volcano plots of all tested groupwise comparisons for primary metabolites showing log2 fold changes and adjusted P-values of groupwise comparisons. (C) HFD+Veh vs. chow, (D) HFD+Pep2.5 vs. chow and (E) HFD+Pep2.5 vs. HFD+Veh. Significantly different analytes are depicted as black circles. Grey dots represent analytes that were not significantly different for the respective comparison. Grey dashed lines indicate absolute log2 fold change of 1.

