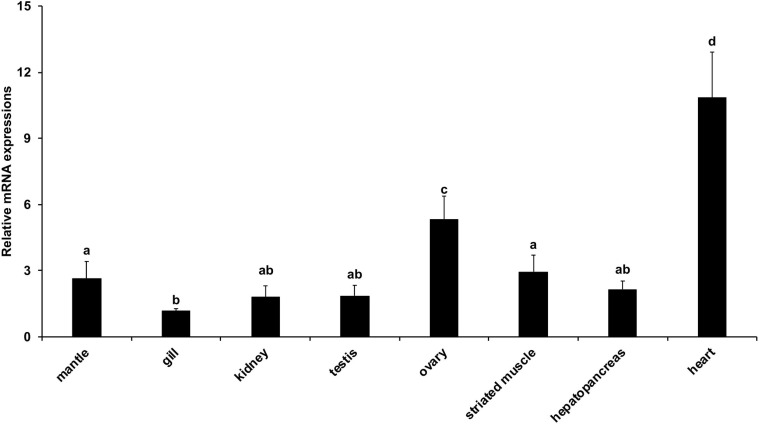
FIGURE 5.
Relative expression levels of AiPC4 in tissues of bay scallop. Three replicates were performed for each adult tissue and three technical replicates were conducted for each PCR. The comparison of the expression levels of AiPC4 among different tissues as performed using one way ANOVA followed by with a post hoc test. Bars with different superscripts indicate significant differences (P < 0.05).

