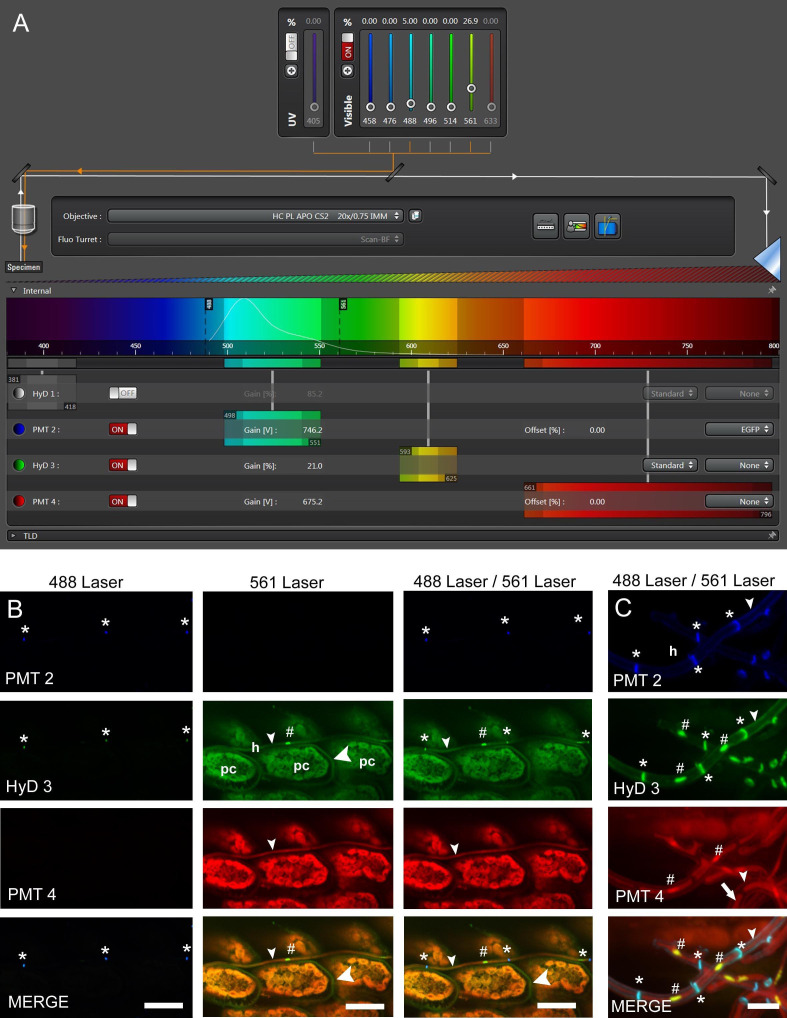
Figure 4. Confocal laser scanning microscopy (CLSM) of E. festucae in hard fescue.
A. Settings for CLSM (here using a Leica TCS SP8 microscope) of samples stained with WGA-AF488, aniline blue and propidium iodide. B and C. CLS micrographs depicting the different and merged fluorescence signals captured with detectors (PMT 2, PMT 4 and HyD 3) that collect light of defined wave lengths (as shown in A). The laser used to excite the samples is also indicated. (B) Endophytic hyphae (h) of E. festucae Fl1 in between plant cells (pc) of Festuca trachyphylla leaf blade. The emission fluorescence from WGA-AF488 excited by the 488 nm argon ion laser is captured with the PMT 2 and also the HyD 3 detector by crossover of fluorescence emission. WGA-AF488 stains chitin only present in septa (asterisk) of endophytic hyphae, plant cells are not stained. The emission fluorescence from AB, PI and plant (chlorophyll) autofluorescence excited by the 561 nm DPSS laser is captured with the HyD 3 detector. PI stains nuclei (hash) of endophytic hyphae. AB stains β-D-1,3-glucans in fungal (small arrowhead) and plant cell walls (big arrowhead). Autofluorescence of chlorophyll and fungal cytoplasm is captured with the HyD 3 and PMT 4 detector. Note that the green (HyD 3) and red (PMT 4) pseudocolors are combined to orange in the merged images. (C) Epiphyllous hyphae (h) of E. festucae Fl1 on the Festuca trachyphylla blade. WGA-AF488 stains chitin in septa (asterisk) and the cell wall (small arrowhead) of epiphyllous hyphae. The weak WGA-AF488 signal captured with PMT 2 indicates that the hyphae shown here just start unmasking and/or accumulating chitin at the cell wall. The HyD 3 detector captures the PI nuclei signal (hash), the WGA-AF488 signal of septa and cell wall (asterisk) and the AB stained fungal cell wall (small arrowhead). The PMT 4 detector captures the AB stained fungal cell wall (small arrowhead) and the fungal cytoplasm (arrow). Scale bars: B = 20 µm, C = 5 µm.

