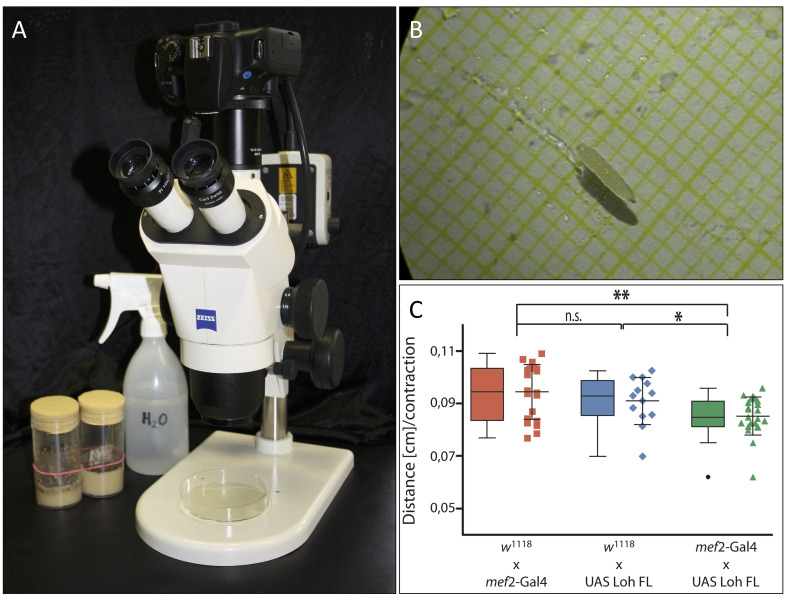
Figure 1. Experimental setup and data representation.
A. Experimental setup. Camecoora attached to the stereomicroscope with the Petri dish placed underneath. B. Third instar larva in humidified Petri dish. The underlying graph paper is clearly visible. C. Graphical output of acquired data made via GraphPad Prism (©GraphPad Software).

