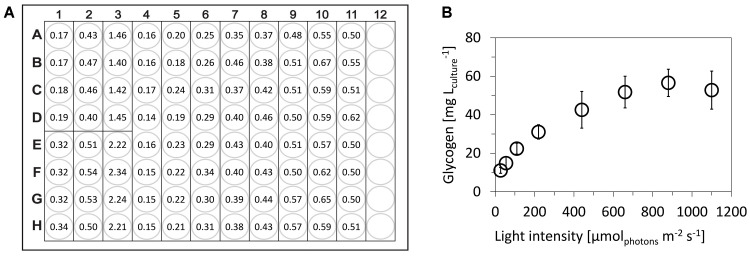
Figure 4. Determination of glycogen content in cyanobacterium Synechocystis sp. PCC 6803.
A. Representative measurement (raw data) of A490 within single 96-well plate, following scheme from Figure 2: A1-H3: six points of glucose calibration (25-500 μg ml-1), A4-H11: eight independent samples of Synechocystis cells that were cultivated under 27.5-1,100 μmolphotons m-2 sec-1 of red light. B. Final glycogen content in Synechocystis cells: the open circles represent averages from five independent experiments, the error bars represent standard deviations. Synechocystis was cultivated in a flat-panel photobioreactor ( Nedbal et al., 2008 ) in a quasi-continuous cultivation regime under growth saturated conditions as described previously ( Zavřel et al., 2015b ). Glycogen was measured within five independent 96-well plates. The wells filled only with water (blanks, not used in this particular case) have A490 around 0.06.

