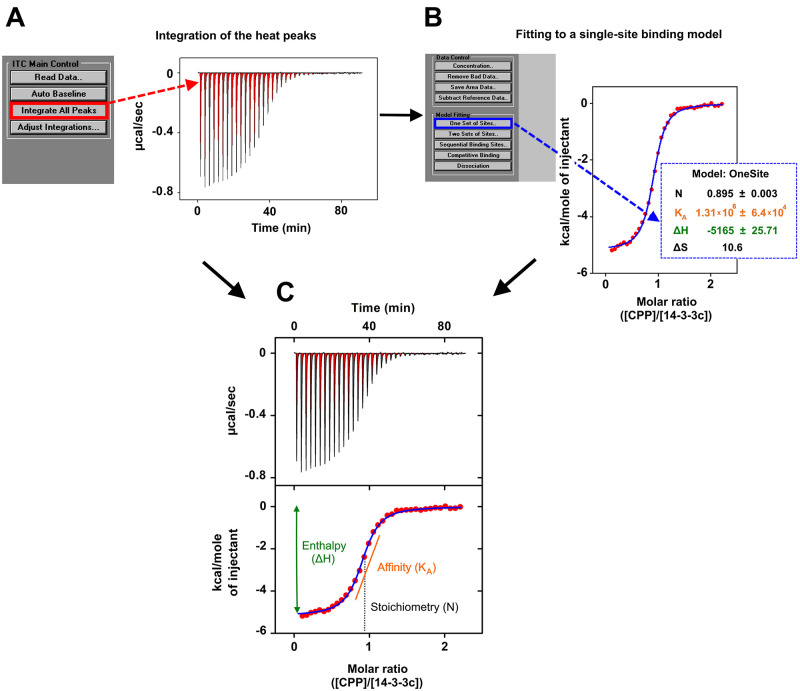
Figure 2. ITC measurement of CPP–14-3-3c interaction.
A. Raw ITC data of CPP (500 μM) binding to 14-3-3c (50 μM). The area of the negative heat changes (μcal/sec) during successive injections of 10 μl of CPP into the sample cell containing 14-3-3c was calculated by selecting the option “integrate all peaks” from the ITC main control list in order to measure the amount of heat released by each CPP injection of the titration. The area of the peaks is colored in red. B. The quantified heat changes (red filled circles), normalized per mole of CPP injected and plotted against the molar ratio of CPP : 14-3-3c, were fitted to a single-site binding model by selecting the option “One set of sites” in the model fitting list implemented in the software. This generates the fitting curve (blue line) that interpolates the heat changes (red filled circles), and the related values of stoichiometry (N, black labelled), association equilibrium constant (KA, orange labelled), enthalpy (∆H, green labelled), and entropy (∆S black labelled) of the binding reaction. All these values are shown in the blue dotted box. C. Final ITC figure composed by an upper panel (corresponding to panel A) and lower panel (corresponding to panel B). Lower panel shows also the schematic representation of the calculations performed by the software to obtain: ∆H as the difference between the initial H value and the plateau H value (green line with double arrowheads); KA, which is the slope value of the orange line that intercepts the exponential phase of the isothermal curve (blue line); N, which is to the molar ratio (CPP:14-3-3c) at the centre of the isothermal curve (indicated by the black dotted line).

