
Figure 3.
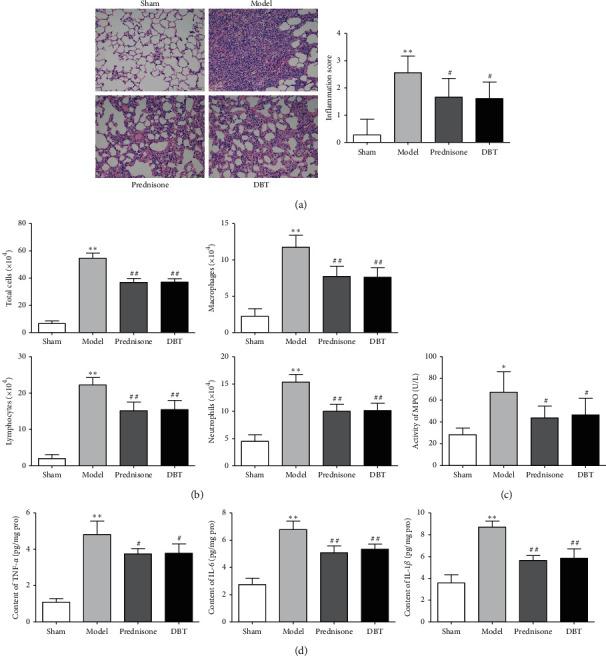
Effect of DBT on pulmonary inflammation in rats with PF. (a) Pathologic changes of lung tissues evaluated by H&E staining (scale bar = 50 μm) and assessed by the Szapiel score (n = 18). (b) Cell counts and classification in BALF (n = 8). (c) MPO activity tested by an examination kit (n = 8). (d) Levels of TNF-α, IL-6, and IL-1β in lung tissues examined by ELISA (n = 8). ∗P < 0.05 and ∗∗P < 0.01 versus sham group; #P < 0.05 and ##P < 0.01 versus model group.