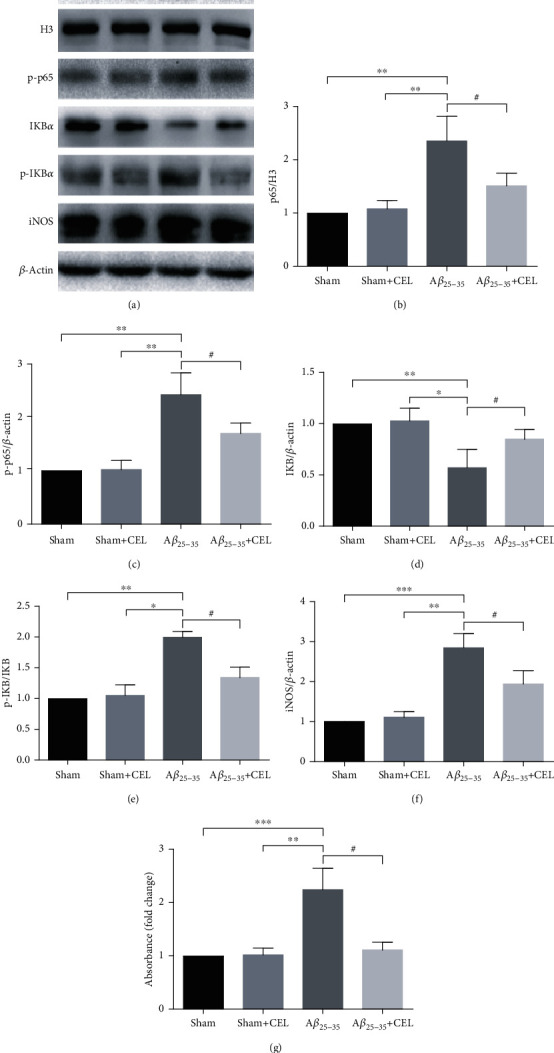
Figure 3.

Celastrol inhibited Aβ25-35-induced NF-κB signalling pathway activation. (a–c) Quantitative analysis using western blot showed that cytoplasmic p-p65 expression and nuclear p65 levels were significantly downregulated by CEL. Data are represented as mean ± SD (n = 4). ∗∗p < 0.01 vs. sham group and #p < 0.05 vs. Aβ25-35 group. (a, d, e) CEL markedly upregulated IKBα expression and decreased p-IKBα levels. Data are represented as mean ± SD (n = 4). ∗p < 0.05 and ∗∗p < 0.01 vs. sham group and #p < 0.05 vs. Aβ25-35 group. (a, f). CEL markedly downregulated iNOS expression in CA1 region. Data are represented as mean ± SD (n = 4). ∗∗p < 0.01 and ∗∗∗p < 0.001 compared with the sham group and #p < 0.05 vs. Aβ25-35 group. (g) ELISA assay showing a more pronounced decrease of NF-κB p65-DNA binding in CEL group. ∗∗p < 0.01 and ∗∗∗p < 0.001 compared with the sham group and #p < 0.05 vs. Aβ25-35 group. Data are represented as mean ± SD (n = 6).
