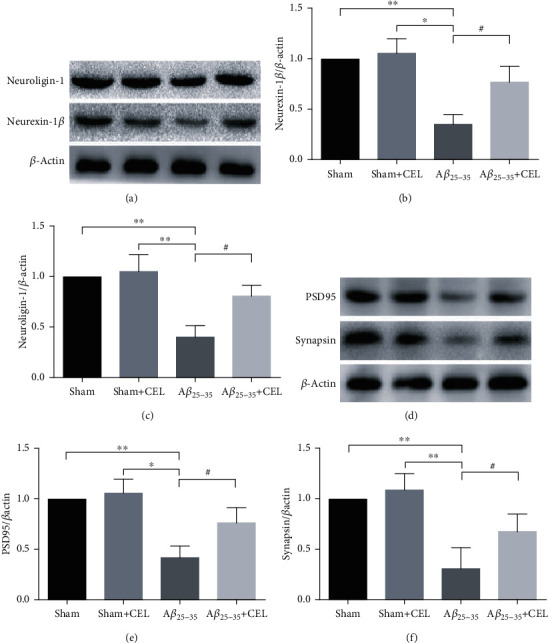
Figure 4.

Celastrol upregulated neurexin-1β, neuroligin-1, PSD95, and synapsin expression levels. (a) Representative western blot images of neurexin-1β and neuroligin-1 proteins. (b, c) CEL markedly upregulated neurexin-1β and neuroligin-1 expression levels. Data are represented as mean ± SD (n = 4). ∗p < 0.05 and ∗∗p < 0.01 compared with the sham group and #p < 0.05 vs. Aβ25-35 group. (d) Representative western blot images of PSD95 and synapsin proteins. (e, f) CEL markedly upregulated PSD95 and synapsin expression levels. Data are represented as mean ± SD (n = 4). ∗p < 0.05 and ∗∗p < 0.01 compared with sham group and #p < 0.05 vs. Aβ25-35 group.
