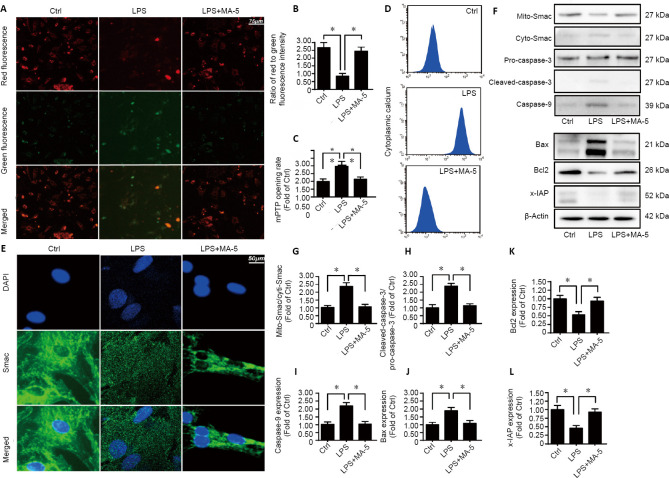
Figure 2.
MA-5 protects the function of mitochondria.
(A, B) Mitochondrial membrane potential. Red fluorescence: an indicator of increased mitochondrial membrane potential; green fluorescence: an indicator of reduced mitochondrial membrane potential. Compared with vehicle control, the ratio of red/green fluorescence intensity was decreased; and MA-5 inhibited this effect. (C) mPTP opening rate. (D) Cellular calcium was detected using flow cytometry. (E) Immunofluorescence staining of Smac (green, Alexa Fluor® 594). Smac diffusion into the cytoplasm and/or nucleus was increased by LPS treatment but decreased by MA-5 treatment. (F–L) Western blot analysis of mito-Smac, cyto-Smac, pro-caspase-3, cleaved-caspase-3, caspase-9, Bax, Bcl2, and x-IAP. Each immunoblot was normalized to the corresponding signal for β-actin (optical density ratio to control). (B, C, G–L) Data are expressed as the mean ± SEM (n = 3). *P < 0.05 (one-way analysis of variance with Dunnett’s post hoc test). Ctrl: Vehicle control group; cyto-Smac: cytoplasmic second mitochondria-derived activator of caspase; DAPI: 4′,6-diamidino-2-phenylindole; LPS: lipopolysaccharides; MA-5: mitochonic acid 5; mito-Smac: mitochondrial second mitochondria-derived activator of caspase; mPTP: mitochondrial permeability transition pore; x-IAP: X-linked inhibitor of apoptosis protein.

