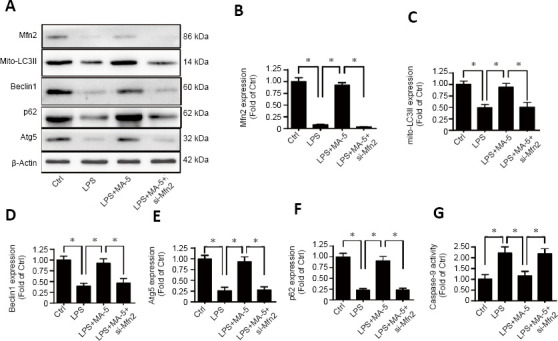
Figure 3.

MA-5 enhances mitophagy though Mfn2.
(A–F) Western blot analysis of Mfn2, mito-LC3II, Beclin1, Atg5, and p62. Each immunoblot was normalized to the corresponding signal for β-actin (optical density ratio to control). (G) Caspase-9 activity was determined to evaluate the effect of MA-5 treatment on BV-2 cells under LPS treatment following MFN2 knockdown. (B–G) Data are expressed as the mean ± SEM (n = 3). *P < 0.05 (one-way analysis of variance with Dunnett’s post hoc test). Atg5: Autophagy related 5; Ctrl: vehicle control group; LPS: lipopolysaccharides; MA-5: mitochonic acid 5; Mfn2: Mitofusin 2; mito-LC3II: mitochondrial microtubule-associated proteins 1A/1B light chain 3B II; si-Mfn2: small interfering RNA of Mfn2.
