
Figure 2.
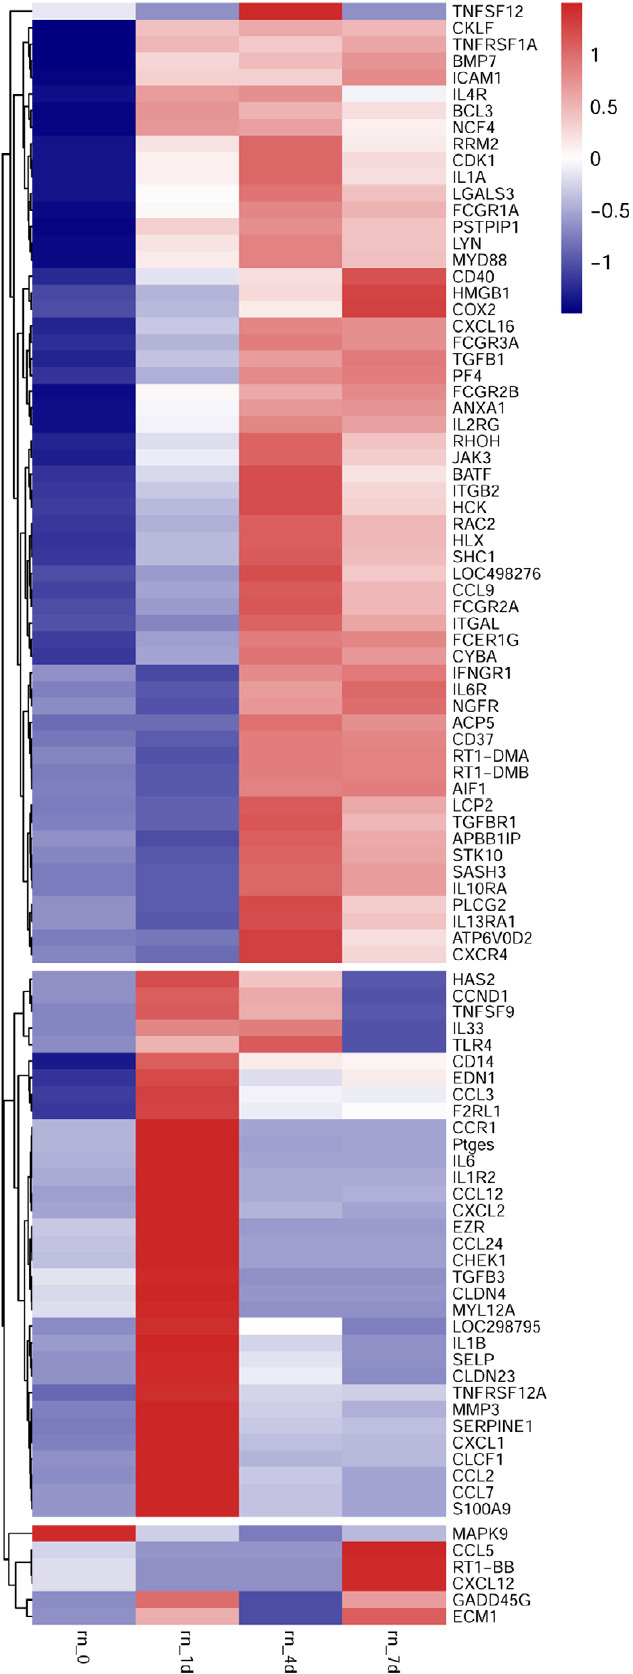
Heatmap and cluster dendrogram of integrated differentially expressed genes involved in inflammatory responses at 0, 1, 4, and 7 days following spinal cord injury.
The color scale shown at the top illustrates the relative expression level of the indicated mRNA across all samples. Red denotes expression > 0, and blue denotes expression < 0.