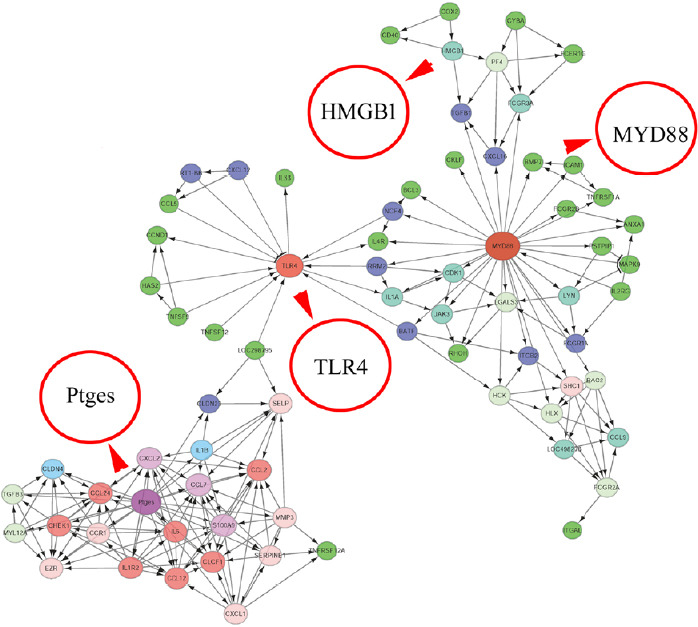
Figure 3.

A reconstructed gene network was created using the Ingenuity Pathway Analysis software on the basis of integrated differentially expressed genes involved in inflammatory responses.
The different circles represent gene weights, while the arrows indicate interaction relationships. HMGB1: High mobility group box 1; MYD88: myeloid differentiation factor 88; Ptges: prostaglandin E synthase; TLR4: Toll-like receptor 4.
