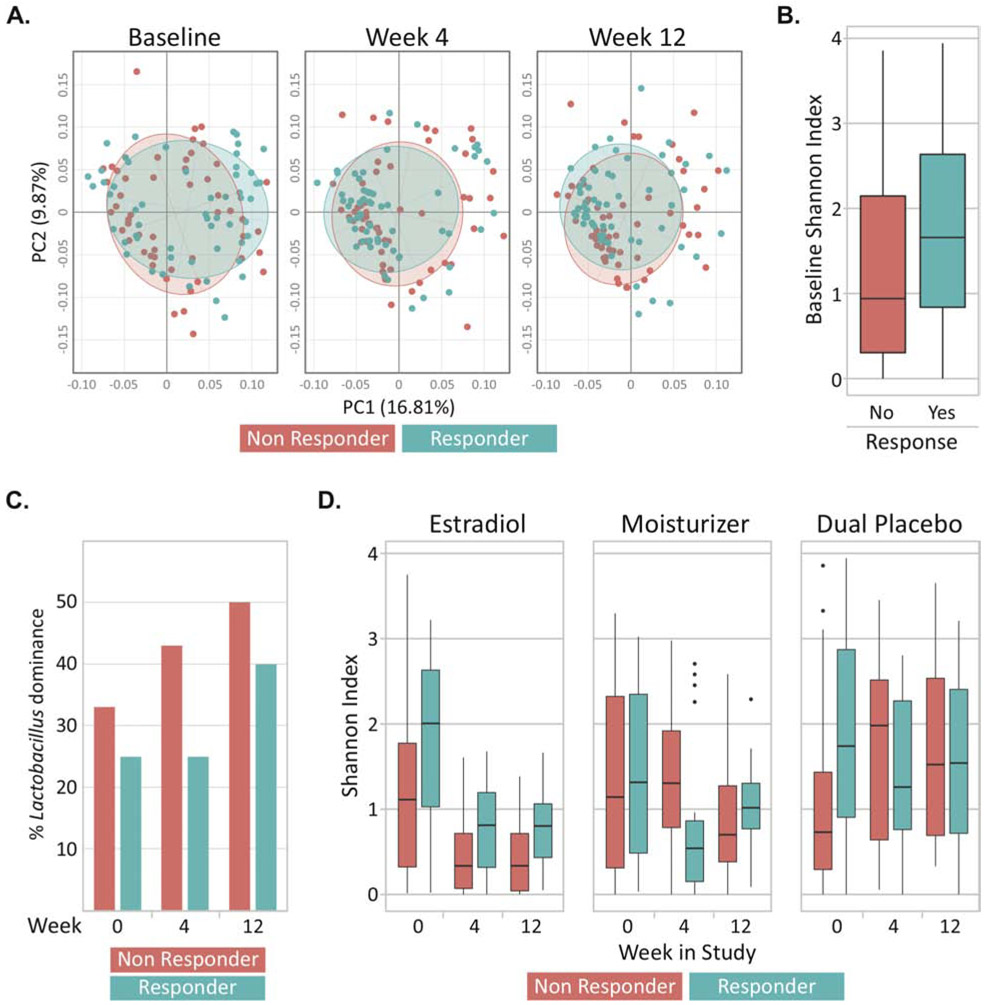
Figure 2.
(A) Beta diversity represented by Principle Coordinate Analysis plots. Each dot represents the bacterial community in a single participant and data is shown across three timepoints; baseline, week 4 and week 12. Axes are the coordinates of maximal variability in the multivariate data with PC1 and PC2 explaining 16.81% and 9.87% of the variation, respectively. The bacterial community was similar between responders (n=58 and 58 at weeks 4 and 12, respectively) and non-responders throughout the trial (n=60 and 59 at weeks 4 and 12). (B) Responders had a higher median Shannon index (α -diversity) at enrollment compared to non-responders (p = 03). (C) There was no statistically significant difference in the proportion of women with Lactobacillus dominance between responders and non-responders at any visit. (D) The Shannon index decreased significantly throughout the trial, especially in the estrogen and moisturizer arms, but was not associated with responder status. Responders were defined as women who had a ≥2-point decrease in most bothersome symptom (MBS) severity over 12 weeks of treatment and non-responders were defined as women who had <1-point decrease.

